Supply and Demand
Daniel Gray
18 min read
Listen to this study note
Study Guide Overview
This study guide covers supply and demand, focusing on the supply and demand model. Key concepts include markets, demand and supply curves, elasticity, market equilibrium and disequilibrium, government intervention, and international trade. It also covers calculating various elasticities (price, income, cross-price) and analyzing the effects of price controls, taxes, tariffs, and quotas.
#AP Microeconomics Unit 2: Supply and Demand - The Ultimate Study Guide
Welcome to Unit 2! This unit is all about the core of microeconomics: supply and demand. Get ready to master the concepts that will help you ace the exam. Let's dive in!
#Unit 2 Overview: The Heart of Microeconomics
Unit 2 is where we get into the nitty-gritty of microeconomics, focusing on the fundamental supply and demand model. This unit builds the foundation for understanding how markets work, and it's crucial for your success on the AP exam. We'll cover:
- Markets: The interaction of consumers and producers.
- Demand and Supply Curves: How consumers and producers react to price changes.
- Elasticity: How sensitive demand and supply are to price changes.
- Market Equilibrium: Where supply and demand meet.
- Market Disequilibrium: What happens when markets aren't in equilibrium.
- Government Intervention: How policies like price controls and taxes affect markets.
- International Trade: How global markets impact domestic markets.
Unit 2 is a high-value topic on the AP exam! Make sure you understand all the concepts well.
#2.1: Demand - What Consumers Want
Demand is all about how much consumers want to buy at different price points. The central question is: "How much are consumers willing to buy at a given price?" 💡
-
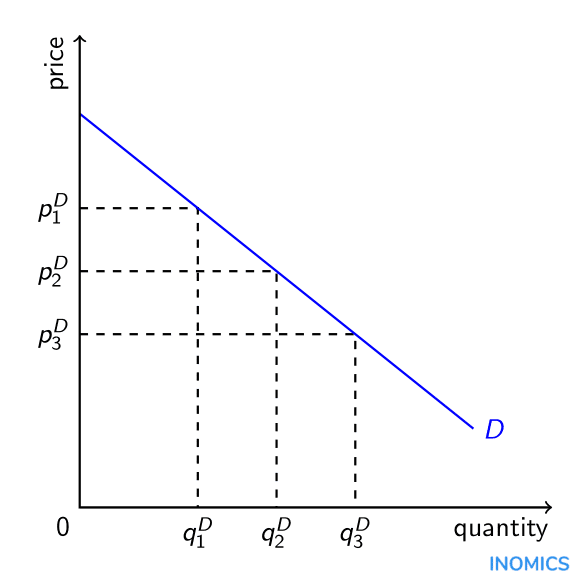
Law of Demand: As prices rise, the quantity demanded falls. This is why the demand curve slopes downward.
Think of it like this: when things get more expensive, people buy less of them.
-
Demand Curve: A graphical representation of the law of demand. It shows the relationship between price and quantity demanded.
-
Shifts in the Demand Curve: Changes in factors other than price (like income, tastes, or expectations) cause the entire demand curve to shift.
Remember: Price changes cause movement along the curve, while other factors cause the entire curve to shift. Think "Push along, Shift".
Practice Question
Multiple Choice Questions:
-
Which of the following would cause a shift in the demand curve for coffee? (a) A decrease in the price of coffee (b) An increase in the price of tea (c) A change in the technology used to produce coffee (d) An increase in the price of sugar
-
According to the law of demand, what happens to the quantity demanded of a good when its price increases? (a) It increases (b) It decreases (c) It remains the same (d) It fluctuates randomly
Free Response Question:
Consider the market for smartphones. Assume the market is initially in equilibrium.
(a) Draw a correctly labeled graph of the smartphone market, showing the equilibrium price and quantity.
(b) Suppose there is a significant increase in consumer income. On your graph from part (a), show the effect of this change on the market for smartphones. Label the new equilibrium price and quantity.
(c) Explain the effect of this change on consumer surplus and producer surplus.
Answer Key:
Multiple Choice Questions:
- (b) An increase in the price of tea
- (b) It decreases
Free Response Question:
(a) Graph should show a downward-sloping demand curve, an upward-sloping supply curve, and an equilibrium point where they intersect. Axes should be labeled as price and quantity.
(b) Graph should show a rightward shift of the demand curve, resulting in a higher equilibrium price and quantity.
(c) Consumer surplus and producer surplus both increase with the increase in demand. Consumer surplus increases because the new equilibrium price is higher, and producer surplus increases because they sell more at a higher price.
#2.2: Supply - What Producers Offer
Supply is about how much producers are willing to sell at different prices. The key question here is: "At the current price point, how much am I willing to supply?" 🏭
-
Law of Supply: As prices rise, the quantity supplied increases. This is why the supply curve slopes upward.
Producers want to sell more when they can get more money for their goods.
-
Supply Curve: A graphical representation of the law of supply. It shows the relationship between price and quantity supplied.
-
Shifts in the Supply Curve: Changes in factors other than price (like input costs, technology, or expectations) cause the entire supply curve to shift.
Think of it like this: if production costs go down, suppliers will supply more at each price point, shifting the curve to the right and vice versa.

Practice Question
Multiple Choice Questions:
-
Which of the following would cause a shift in the supply curve for wheat? (a) An increase in the price of wheat (b) A decrease in the price of fertilizer (c) An increase in consumer income (d) A decrease in the price of bread
-
According to the law of supply, what happens to the quantity supplied of a good when its price decreases? (a) It increases (b) It decreases (c) It remains the same (d) It fluctuates randomly
Free Response Question:
Consider the market for electric cars. Assume the market is initially in equilibrium.
(a) Draw a correctly labeled graph of the electric car market, showing the equilibrium price and quantity.
(b) Suppose there is a technological advancement that reduces the cost of producing electric cars. On your graph from part (a), show the effect of this change on the market for electric cars. Label the new equilibrium price and quantity.
(c) Explain the effect of this change on consumer surplus and producer surplus.
Answer Key:
Multiple Choice Questions:
- (b) A decrease in the price of fertilizer
- (b) It decreases
Free Response Question:
(a) Graph should show a downward-sloping demand curve, an upward-sloping supply curve, and an equilibrium point where they intersect. Axes should be labeled as price and quantity.
(b) Graph should show a rightward shift of the supply curve, resulting in a lower equilibrium price and a higher equilibrium quantity.
(c) Consumer surplus increases because the new equilibrium price is lower, and producer surplus may increase or decrease depending on the elasticity of demand, but overall, the total surplus increases.
#2.3: Price Elasticity of Demand - How Sensitive Are Consumers?
Price elasticity of demand (PED) measures how much the quantity demanded changes when the price changes. It's all about sensitivity! 📏
-
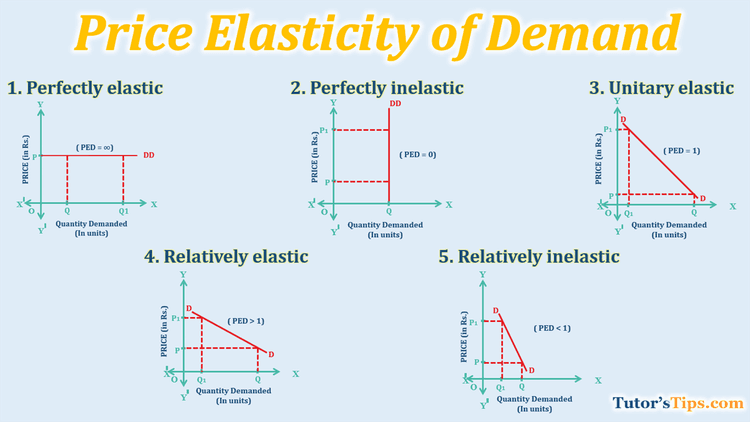
Elastic Demand: Quantity demanded is very sensitive to price changes. A small price change leads to a large change in quantity demanded. (PED > 1)
-
Inelastic Demand: Quantity demanded is not very sensitive to price changes. A price change leads to a small change in quantity demanded. (PED < 1)
-
Unit Elastic Demand: Quantity demanded changes proportionally to price changes. (PED = 1)
Think of it like this: if a good is a necessity (like medicine), demand is inelastic. If it's a luxury (like a fancy vacation), demand is elastic.
- Calculating PED:
PED = \frac{% \text{ Change in Quantity Demanded}}{% \text{ Change in Price}}
Practice Question
Multiple Choice Questions:
-
If the price of a good increases by 10% and the quantity demanded decreases by 20%, the price elasticity of demand is: (a) 0.5 (b) 2 (c) -2 (d) -0.5
-
Which of the following goods is most likely to have an inelastic demand? (a) Airline tickets (b) Designer handbags (c) Gasoline (d) Movie tickets
Free Response Question:
Suppose the price of coffee increases from <math-inline>4 to </math-inline>5 per cup, and as a result, the quantity demanded decreases from 100 cups to 80 cups per day.
(a) Calculate the price elasticity of demand for coffee using the midpoint method.
(b) Is the demand for coffee elastic, inelastic, or unit elastic in this price range?
(c) Explain one factor that could make the demand for coffee more or less elastic.
Answer Key:
Multiple Choice Questions:
- (c) -2
- (c) Gasoline
Free Response Question:
(a) Using the midpoint method:
(b) The demand for coffee is unit elastic in this price range.
(c) Factors that could affect elasticity include the availability of substitutes (more substitutes make demand more elastic) and whether the good is a necessity or a luxury (necessities tend to be more inelastic).
#2.4: Price Elasticity of Supply - How Sensitive Are Producers?
Price elasticity of supply (PES) measures how much the quantity supplied changes when the price changes. It's the producer's version of PED! 🏭
-
Elastic Supply: Quantity supplied is very sensitive to price changes. A small price change leads to a large change in quantity supplied. (PES > 1)
-
Inelastic Supply: Quantity supplied is not very sensitive to price changes. A price change leads to a small change in quantity supplied. (PES < 1)
-
Unit Elastic Supply: Quantity supplied changes proportionally to price changes. (PES = 1)
Think of it like this: if producers can easily increase production, supply is elastic. If it's hard to increase production (like with limited resources), supply is inelastic.
- Calculating PES:
PES = \frac{% \text{ Change in Quantity Supplied}}{% \text{ Change in Price}}

Practice Question
Multiple Choice Questions:
-
If the price of a good increases by 5% and the quantity supplied increases by 15%, the price elasticity of supply is: (a) 0.33 (b) 3 (c) -3 (d) -0.33
-
Which of the following goods is most likely to have an inelastic supply? (a) Smartphones (b) Agricultural products (short run) (c) Clothing (d) Software
Free Response Question:
Suppose the price of apples increases from <math-inline>1 to </math-inline>1.20 per pound, and as a result, the quantity supplied increases from 1000 pounds to 1100 pounds per day.
(a) Calculate the price elasticity of supply for apples using the midpoint method.
(b) Is the supply of apples elastic, inelastic, or unit elastic in this price range?
(c) Explain one factor that could make the supply of apples more or less elastic.
Answer Key:
Multiple Choice Questions:
- (b) 3
- (b) Agricultural products (short run)
Free Response Question:
(a) Using the midpoint method:
(b) The supply of apples is inelastic in this price range.
(c) Factors that could affect elasticity include the time horizon (supply is more elastic in the long run) and the availability of inputs (more available inputs make supply more elastic).
#2.5: Other Elasticities - Beyond Price
Elasticity isn't just about price! We can also look at how demand changes with income and the price of related goods. 🧐
- Income Elasticity of Demand: Measures how much quantity demanded changes with changes in income.
-
Normal Good: Demand increases with income (positive income elasticity).
-
Inferior Good: Demand decreases with income (negative income elasticity).
-
Think of it like this: if you buy more of something as you get richer, it's a normal good. If you buy less, it's an inferior good.
- Cross-Price Elasticity of Demand: Measures how much quantity demanded of one good changes with changes in the price of another good.
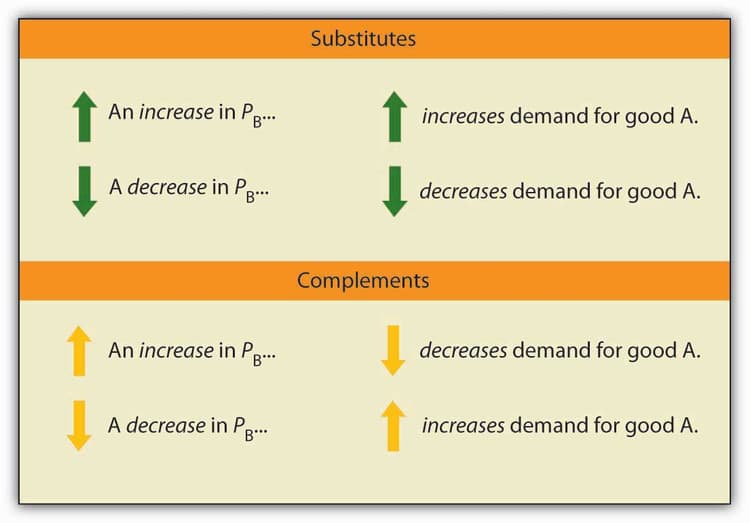
- Substitutes: If the price of good B increases and the quantity demanded of good A increases (positive cross-price elasticity).
- Complements: If the price of good B increases and the quantity demanded of good A decreases (negative cross-price elasticity).
- Unrelated: If the cross-price elasticity is 0, the goods are unrelated.

Practice Question
Multiple Choice Questions:
-
If the income elasticity of demand for a good is -0.5, the good is considered: (a) A normal good (b) An inferior good (c) A substitute good (d) A complement good
-
If the cross-price elasticity of demand between two goods is 2, the goods are considered: (a) Complements (b) Substitutes (c) Unrelated (d) Normal goods
Free Response Question:
Suppose that when consumer income increases by 10%, the quantity demanded for bus rides decreases by 5%, and the quantity demanded for restaurant meals increases by 15%.
(a) Calculate the income elasticity of demand for bus rides and restaurant meals.
(b) Are bus rides a normal good or an inferior good? Explain.
(c) Are restaurant meals a normal good or an inferior good? Explain.
Answer Key:
Multiple Choice Questions:
- (b) An inferior good
- (b) Substitutes
Free Response Question:
(a) Income elasticity of demand for bus rides: \frac{-5%}{10%} = -0.5. Income elasticity of demand for restaurant meals: \frac{15%}{10%} = 1.5
(b) Bus rides are an inferior good because the income elasticity of demand is negative.
(c) Restaurant meals are a normal good because the income elasticity of demand is positive.
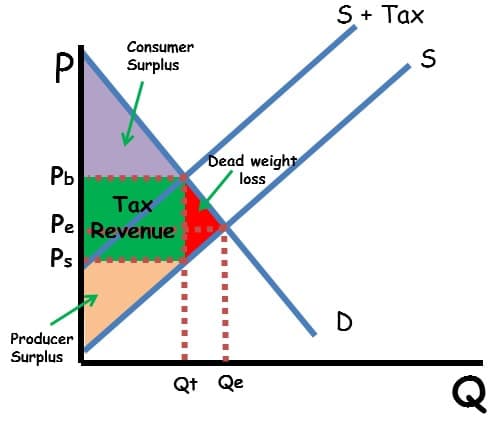
#2.6: Market Equilibrium and Consumer and Producer Surplus
Market equilibrium is where supply and demand meet. It's the sweet spot where the quantity demanded equals the quantity supplied. 🤝
-
Equilibrium: The price and quantity at which the supply and demand curves intersect. At this point, there is no surplus or shortage.
-
Consumer Surplus: The difference between what consumers are willing to pay and what they actually pay. It's the area below the demand curve and above the equilibrium price.
-
Producer Surplus: The difference between what producers are willing to sell for and what they actually receive. It's the area above the supply curve and below the equilibrium price.
Equilibrium is the most efficient outcome. It maximizes total surplus (consumer + producer surplus).

Practice Question
Multiple Choice Questions:
-
Market equilibrium occurs when: (a) Quantity demanded is greater than quantity supplied (b) Quantity supplied is greater than quantity demanded (c) Quantity demanded equals quantity supplied (d) Price is at its maximum
-
Consumer surplus is the area: (a) Above the demand curve and below the equilibrium price (b) Below the demand curve and above the equilibrium price (c) Above the supply curve and below the equilibrium price (d) Below the supply curve and above the equilibrium price
Free Response Question:
Consider the market for bicycles. The demand and supply curves are given by the following equations:
Demand: Supply:
(a) Find the equilibrium price and quantity in the bicycle market.
(b) Calculate the consumer surplus at the equilibrium.
(c) Calculate the producer surplus at the equilibrium.
Answer Key:
Multiple Choice Questions:
- (c) Quantity demanded equals quantity supplied
- (b) Below the demand curve and above the equilibrium price
Free Response Question:
(a) To find equilibrium, set :
Substitute P back into either equation to find Q:
Equilibrium price is <math-inline>60, and equilibrium quantity is 80. (b) Consumer surplus is the area of the triangle below the demand curve and above the equilibrium price. The y-intercept of the demand curve is found by setting Q=0:
#2.7: Market Disequilibrium and Changes in Equilibrium
What happens when the market isn't at equilibrium? We get disequilibrium, which leads to surpluses or shortages. 😬
-
Surplus: When the price is above equilibrium, quantity supplied is greater than quantity demanded. There's too much of the good available.
-
Shortage: When the price is below equilibrium, quantity demanded is greater than quantity supplied. There's not enough of the good available.
-
Deadweight Loss: The loss of total surplus that occurs when the market is not at equilibrium. It's the surplus that's lost because the market isn't operating efficiently.
<common_mistake> Remember: Deadweight loss is a loss to society. It's not just a loss for consumers or producers, but a loss of potential gains from trade. </common_mistake>
<practice_question>
Multiple Choice Questions:
-
A surplus in a market occurs when: (a) Quantity demanded is greater than quantity supplied (b) Quantity supplied is greater than quantity demanded (c) Quantity demanded equals quantity supplied (d) The market is in equilibrium
-
Deadweight loss represents: (a) Gains to consumers (b) Gains to producers (c) A loss of total surplus (d) A transfer of surplus from consumers to producers
Free Response Question:
Consider the market for concert tickets. The demand and supply curves are given by the following equations:
Demand:
(b) Suppose the government sets a price ceiling of </math-inline>30. Calculate the quantity demanded and quantity supplied at this price. Is there a shortage or a surplus?
(c) Calculate the deadweight loss resulting from the price ceiling.
Answer Key:
Multiple Choice Questions:
- (b) Quantity supplied is greater than quantity demanded
- (c) A loss of total surplus
Free Response Question:
(a) To find equilibrium, set :
Substitute P back into either equation to find Q:
Equilibrium price is <math-inline>40, and equilibrium quantity is 60. (b) At a price of </math-inline>30:
There is a shortage of 30 tickets (70 - 40).
(c) The deadweight loss is the area of the triangle formed by the demand and supply curves between the quantities of 40 and 60. The height of the triangle is the difference between the equilibrium price and the price ceiling, which is 10 (40-30). The base of the triangle is the difference between the equilibrium quantity and the quantity supplied at the price ceiling, which is 20 (60-40). Deadweight loss is
#2.8: The Effects of Government Intervention in Markets
The government can get involved in markets through price controls and taxes. These interventions can have significant effects on market outcomes. 🏛️
- Price Controls: Government-imposed limits on prices.
-
Price Ceiling: A maximum legal price. Effective price ceilings are set below the equilibrium price, creating shortages.
-
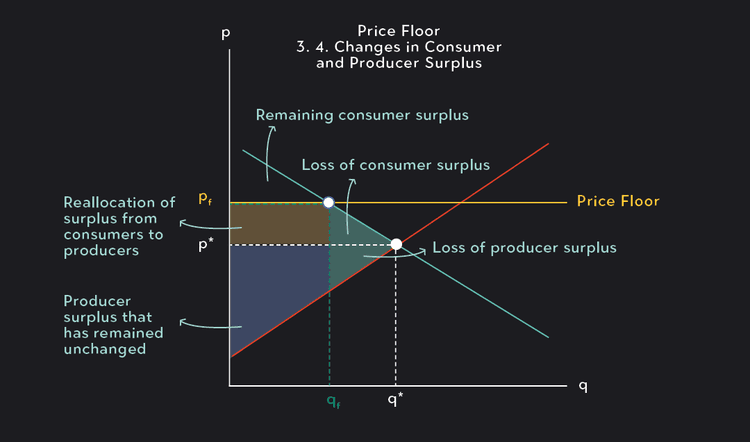
Price Floor: A minimum legal price. Effective price floors are set above the equilibrium price, creating surpluses.
-
Remember: Price ceilings are designed to help consumers, while price floors are designed to help producers.
- Excise Taxes: Per-unit taxes on goods. These shift the supply curve to the left, increasing prices and reducing quantity.
Practice Question
Multiple Choice Questions:
-
A price ceiling set below the equilibrium price will result in: (a) A surplus (b) A shortage (c) No change in the market (d) An increase in producer surplus
-
An excise tax on a good will: (a) Shift the demand curve to the right (b) Shift the supply curve to the right (c) Shift the supply curve to the left (d) Have no effect on the market
Free Response Question:
Consider the market for rental apartments. The demand and supply curves are given by the following equations:
Demand: Supply:
(a) Find the equilibrium price and quantity in the rental apartment market.
(b) Suppose the government imposes a price ceiling of <math-inline>50. Calculate the quantity demanded and quantity supplied at this price. Is there a shortage or a surplus?
(c) Suppose the government imposes a </math-inline>10 per unit tax on landlords. Show the impact of this tax on the supply curve. What is the new equilibrium price and quantity?
Answer Key:
Multiple Choice Questions:
- (b) A shortage
- (c) Shift the supply curve to the left
Free Response Question:
(a) To find equilibrium, set :
Substitute P back into either equation to find Q:
Equilibrium price is <math-inline>60, and equilibrium quantity is 80. (b) At a price of </math-inline>50:
There is a shortage of 40 apartments (100 - 60).
(c) The tax shifts the supply curve to the left. The new supply curve equation is or . To find the new equilibrium, set :
Substitute P back into either equation to find Q:
The new equilibrium price is <math-inline>65, and the new equilibrium quantity is 70. </practice_question>
#2.9: International Trade and Public Policy
Most countries don't operate in a vacuum. International trade can have significant impacts on domestic markets. 🌎
-
World Price: The global price of a good. If the world price is lower than the domestic equilibrium price, a country will import the good.
-
Tariffs: Taxes on imported goods. Tariffs increase the price of imported goods, reducing the quantity of imports and creating deadweight loss.
-
Quotas: Limits on the quantity of imported goods. Quotas also reduce the quantity of imports and create deadweight loss.
<memory_aid> Think of it like this: tariffs and quotas are designed to protect domestic industries, but they also reduce overall efficiency and create deadweight loss. </memory_aid>


<practice_question>
Multiple Choice Questions:
-
If the world price of a good is lower than the domestic equilibrium price, a country will: (a) Export the good (b) Import the good (c) Have no change in trade (d) Impose a tariff
-
A tariff on imported goods will: (a) Increase the quantity of imports (b) Decrease the price of domestic goods (c) Increase the price of imported goods (d) Have no effect on the market
Free Response Question:
Consider the market for textiles in a small country. The domestic demand and supply curves are given by the following equations:
Demand:
(b) Suppose the world price of textiles is </math-inline>30. If the country opens to trade, how many textiles will be imported?
(c) Suppose the government imposes a <math-inline>10 tariff on imported textiles. Calculate the new quantity of imports.
Answer Key:
Multiple Choice Questions:
- (b) Import the good
- (c) Increase the price of imported goods
Free Response Question:
(a) To find equilibrium, set
(c) With a </math-inline>10 tariff, the effective price of imported textiles is <math-inline>40. At this price:$
The country will import 40 textiles (60 - 20).
#Final Exam Focus 🎯
Okay, you've made it through the unit! Here's what to focus on for the exam:
- Supply and Demand Curves: Be able to draw them, shift them, and understand what causes these shifts.
- Elasticity: Know how to calculate PED, PES, income elasticity, and cross-price elasticity, and what they mean.
- Market Equilibrium: Understand how to find it, and how to calculate consumer and producer surplus.
- Government Intervention: Be able to
Continue your learning journey


How are we doing?
Give us your feedback and let us know how we can improve