Market Disequilibrium and Changes in Equilibrium
Nancy Hill
9 min read
Listen to this study note
Study Guide Overview
This study guide covers market equilibrium and disequilibrium, including shortages and surpluses. It explains how shifts in supply and demand affect equilibrium price and quantity, and explores consumer/producer surplus and deadweight loss. Finally, it addresses double-shift problems and provides practice questions.
#AP Microeconomics: Market Equilibrium & Disequilibrium - The Night Before
Hey! Let's make sure you're totally set for your AP Micro exam tomorrow. We're going to break down market equilibrium, disequilibrium, and how shifts in supply and demand affect everything. Think of this as your ultimate cheat sheet, designed to make everything click. Let's get started!
#
Market Equilibrium and Disequilibrium
# Equilibrium: The Sweet Spot
- Definition: Market equilibrium is where the quantity demanded (Qd) equals the quantity supplied (Qs). It's the point where the supply and demand curves intersect. Think of it as the market's happy place where everyone's needs are met. 🤝
- Visual: The intersection of the supply and demand curves.
# Disequilibrium: When Things Get Messy
- Definition: Disequilibrium occurs when Qd ≠ Qs. This happens when the price is either too high or too low, creating either a surplus or a shortage.
- Causes: Usually caused by prices being above or below the equilibrium price.
#
Shortages and Surpluses
# Shortages: Too Much Demand, Not Enough Supply
- Definition: Qd > Qs. Think of it like trying to buy the last concert ticket – everyone wants it, but there aren't enough to go around. 🎫
- Cause: Price is set below the equilibrium price.
- Result: Consumers are willing to buy more than producers are willing to sell.
# Surpluses: Too Much Supply, Not Enough Demand
- Definition: Qs > Qd. Imagine a store with too many of the same item that nobody wants to buy. 🛍️
- Cause: Price is set above the equilibrium price.
- Result: Producers are willing to sell more than consumers are willing to buy.
#Visualizing Shortages and Surpluses
-
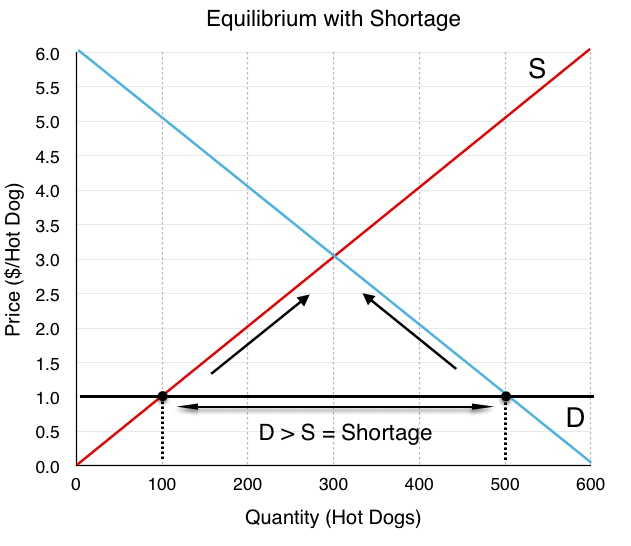
Shortage: Price is below equilibrium, leading to high demand and low supply.
-
Surplus: Price is above equilibrium, leading to low demand and high supply.

Mnemonic: "Surplus is when there is so much supply" and "Shortage is when there is so little supply" Remember, both start with 'S'!
# Market Adjustment: Back to Equilibrium
-
Long-Run Trend: Markets naturally move towards equilibrium. It's like a self-correcting system. 🔄
-
Shortage Adjustment: Price increases as consumers compete for limited goods. Think of it like an auction - prices go up when demand is high.
-
Surplus Adjustment: Price decreases as producers try to sell excess goods. Think of it like a clearance sale - prices drop when there's too much stock.


Key Point: Markets tend to self-correct towards equilibrium because of the incentives for both consumers and producers.
#
Surplus and Deadweight Loss
#Consumer and Producer Surplus
- Consumer Surplus: The benefit consumers get when they pay less than they're willing to. Think of it as the "bargain" you feel when you get a good deal. 🤑
- Producer Surplus: The benefit producers get when they sell for more than they're willing to. Think of it as the profit they make. 💰
- Equilibrium: Total surplus (consumer + producer) is maximized at equilibrium. It's the most efficient outcome.
#Deadweight Loss: The Cost of Disequilibrium
-
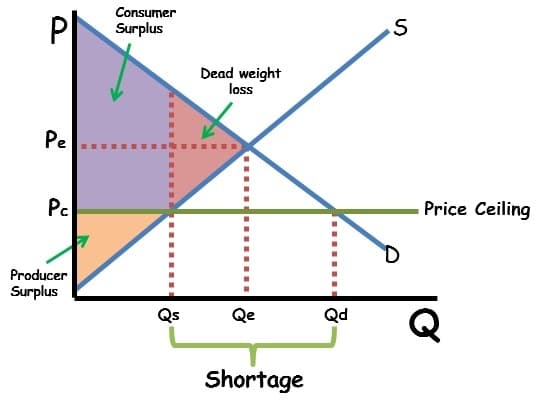
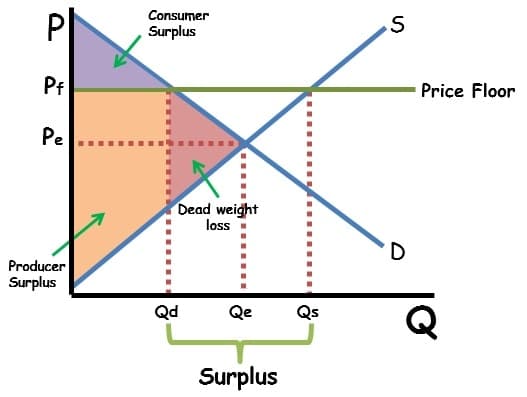
Definition: The loss of total surplus that occurs when the market is not at equilibrium. It's like wasted potential. 💔
-
Shortage: Producers lose surplus because they can't sell at the equilibrium price.
-
Surplus: Consumers lose surplus because they don't buy at the equilibrium price.
Common Mistake: Forgetting that deadweight loss represents a loss of potential total surplus, not just a loss for one group. It's inefficiency in the market.
#
Changes in Market Equilibrium
#Demand Shifts
-
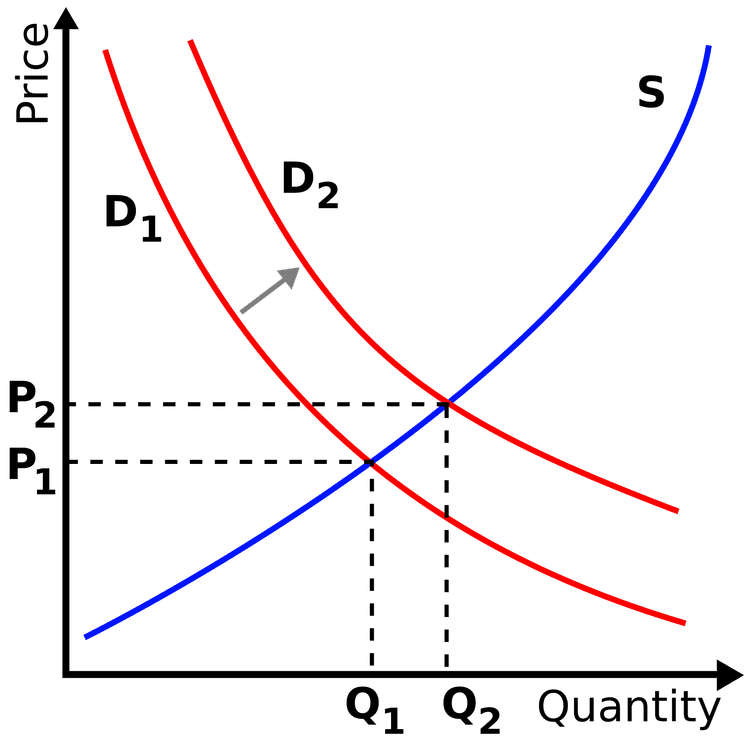
Increase in Demand: Both equilibrium price and quantity increase. Think of it like a popular new product – prices go up and more are sold. 📈
-
Decrease in Demand: Both equilibrium price and quantity decrease. Think of it like a fad that's dying out – prices drop and fewer are sold. 📉

Quick Fact: Demand shifts cause price and quantity to move in the same direction.
#Supply Shifts
-
Increase in Supply: Equilibrium price decreases, and quantity increases. Think of it like a new technology that makes production cheaper – prices drop and more are sold. ⬇️⬆️

-
Decrease in Supply: Equilibrium price increases, and quantity decreases. Think of it like a natural disaster that disrupts production – prices go up and fewer are sold. ⬆️⬇️

Quick Fact: Supply shifts cause price and quantity to move in opposite directions.
#
Double-Shift Problems
#The Indeterminate Outcome
-
Definition: When both supply and demand shift simultaneously, the change in either price or quantity (or both) is indeterminate without additional information. 🤷
-
Why?: The shifts can have conflicting effects on price and quantity. It's like two forces pulling in different directions.
-
Example: Demand increases (price and quantity up), and supply decreases (price up, quantity down). Price increases for sure, but the change in quantity is uncertain.
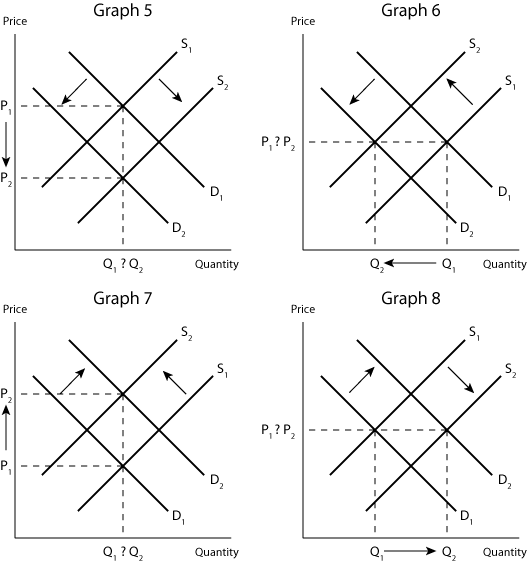

Exam Tip: When you see a double shift problem, draw it out! Graphing is your best friend in these scenarios. Focus on what you can determine, and clearly state what is indeterminate.
#
Final Exam Focus
#Top Priority Topics
- Market Equilibrium: Know how to identify and explain it.
- Shortages and Surpluses: Understand what causes them and how markets adjust.
- Consumer and Producer Surplus: Be able to calculate and identify areas on a graph.
- Deadweight Loss: Understand why it occurs and how to identify it on a graph.
- Shifts in Supply and Demand: Be ready to analyze the impacts of single and double shifts.
#Common Question Types
- Multiple Choice: Often tests your understanding of basic concepts and graph interpretation.
- Free Response: Requires you to draw and explain market changes, often involving surplus and deadweight loss.
#Last-Minute Tips
- Time Management: Don't spend too long on any one question. If you're stuck, move on and come back later.
- Common Pitfalls: Be careful with double shifts and make sure to show your work on FRQs.
- Strategy: Always start by drawing a graph. It will help you visualize the problem and avoid mistakes.
#
Practice Question
Practice Questions
#Multiple Choice Questions
-
Which of the following best describes a market in equilibrium? (A) Quantity demanded is greater than quantity supplied. (B) Quantity supplied is greater than quantity demanded. (C) Quantity demanded equals quantity supplied. (D) There is a shortage of the good. (E) There is a surplus of the good.
-
A price floor set above the equilibrium price will result in: (A) A shortage. (B) A surplus. (C) Equilibrium. (D) No change in the market. (E) Increased consumer surplus.
-
If both supply and demand increase, what is the effect on the equilibrium price and quantity? (A) Price increases, quantity is indeterminate. (B) Price decreases, quantity is indeterminate. (C) Price is indeterminate, quantity increases. (D) Price is indeterminate, quantity decreases. (E) Price and quantity both increase.
#Free Response Question
Assume the market for coffee is initially in equilibrium. Suppose there is a decrease in the price of tea (a substitute for coffee) and a simultaneous increase in the cost of coffee beans (an input for coffee production).
(a) Draw a correctly labeled graph of the coffee market. Show the initial equilibrium price and quantity (P1 and Q1). (2 points)
(b) Show the effect of the decrease in the price of tea on the demand for coffee. Label the new demand curve D2. (1 point)
(c) Show the effect of the increase in the cost of coffee beans on the supply of coffee. Label the new supply curve S2. (1 point)
(d) Indicate the new equilibrium price and quantity (P2 and Q2). (1 point)
(e) What is the effect on the equilibrium price of coffee? Explain. (2 points)
(f) What is the effect on the equilibrium quantity of coffee? Explain. (2 points)
#FRQ Scoring Guide
(a) (2 points) - 1 point for correctly labeled axes (price and quantity) and curves (supply and demand). - 1 point for showing the initial equilibrium point (P1, Q1).
(b) (1 point) - 1 point for shifting the demand curve to the left and labeling it D2. (c) (1 point) - 1 point for shifting the supply curve to the left and labeling it S2. (d) (1 point) - 1 point for correctly identifying the new equilibrium point (P2, Q2) at the intersection of D2 and S2. (e) (2 points) - 1 point for stating that the equilibrium price increases. - 1 point for explaining that both the decrease in demand and the decrease in supply contribute to an increase in price.
(f) (2 points) - 1 point for stating that the equilibrium quantity is indeterminate. - 1 point for explaining that the decrease in demand decreases quantity, while the decrease in supply decreases quantity, leading to an indeterminate net effect on quantity.
Continue your learning journey

How are we doing?
Give us your feedback and let us know how we can improve


