The Effects of Government Intervention in Markets
Nancy Hill
8 min read
Listen to this study note
Study Guide Overview
This study guide covers government intervention in markets, focusing on price controls (price ceilings and floors) and excise taxes. It explains how price ceilings cause shortages, price floors cause surpluses, and excise taxes shift the supply curve. The guide also explains tax incidence and how elasticity of supply and demand determines who bears more of the tax burden. It includes practice questions and emphasizes graphing these concepts.
#AP Microeconomics: Government Intervention Study Guide
Welcome! This guide is designed to help you ace the AP Microeconomics exam by focusing on key concepts related to government intervention in markets. Let's get started!
#
Markets and Government Intervention
In microeconomics, a market is where buyers and sellers interact. The government can influence these markets through price controls and taxes. Understanding these interventions is crucial for the exam. Let's dive in!
#Price Controls: Ceilings and Floors
Government-imposed price controls can alter market outcomes. These controls come in two main forms: price ceilings and price floors.
#Price Ceilings
A price ceiling is a maximum legal price. It's only effective if set below the equilibrium price. Think of it as a 'ceiling' that the price can't go above. A classic example is rent control.
Price ceilings lead to shortages because the quantity demanded exceeds the quantity supplied at the controlled price. This creates deadweight loss.
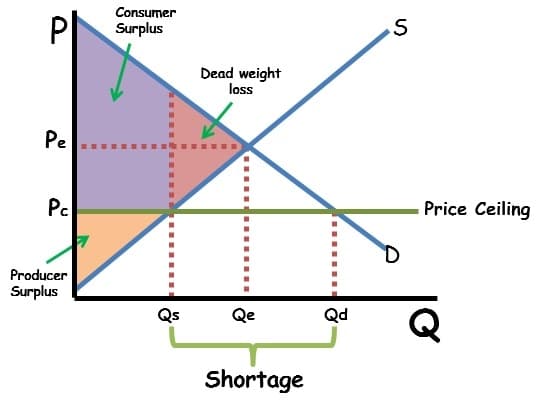
- Graph Explanation:
- Pc is the price ceiling.
- The area below the demand curve and above the price ceiling up to Qs represents consumer surplus.
- Producer surplus is reduced due to the lower price and quantity.
- The triangle formed by the original equilibrium and the new quantities represents deadweight loss.
#Price Floors
A price floor is a minimum legal price. It's only effective if set above the equilibrium price. Think of it as a 'floor' that the price can't go below. A common example is the minimum wage.
Price floors lead to surpluses because the quantity supplied exceeds the quantity demanded at the controlled price. This also creates deadweight loss.
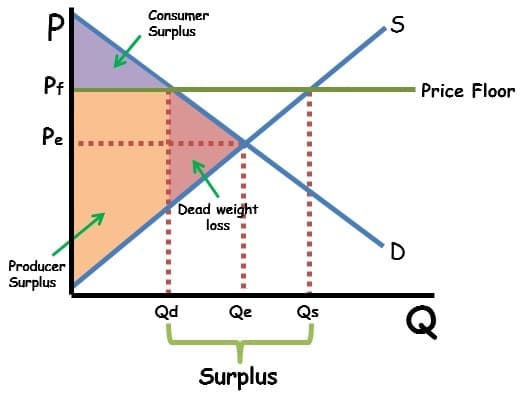
- Graph Explanation:
- Pf is the price floor.
- The area below the demand curve and above the price floor up to Qd represents consumer surplus.
- Producer surplus is reduced due to the lower quantity.
- The triangle formed by the original equilibrium and the new quantities represents deadweight loss.
#Non-Effective Price Controls
Remember, price controls are only effective if they interfere with the market equilibrium. If a price ceiling is set above the equilibrium or a price floor is set below it, the market will operate at the equilibrium price and quantity.
Practice Question
Multiple Choice Questions:
-
Question: A price ceiling set above the equilibrium price will:
- A) Cause a shortage
- B) Cause a surplus
- C) Have no effect on the market
- D) Increase producer surplus
- Answer: C
-
Question: A price floor is set at 8. What is the likely outcome?
- A) Shortage of goods
- B) Surplus of goods
- C) The market will operate at $8
- D) Increased consumer surplus
- Answer: B
Free Response Question (FRQ):
Question: Draw a correctly labeled graph of a market for a good. On your graph, show the effect of a price ceiling set below the equilibrium price. Identify the area of consumer surplus, producer surplus, and deadweight loss. Explain the impact of the price ceiling on market efficiency.
Scoring Guidelines:
- (1 point) Correctly labeled supply and demand curves.
- (1 point) Equilibrium price and quantity identified.
- (1 point) Price ceiling drawn below equilibrium.
- (1 point) New quantity (Qs) identified.
- (1 point) Consumer surplus, producer surplus, and deadweight loss identified.
- (1 point) Explanation of reduced market efficiency due to deadweight loss.
#Excise Taxes and Tax Incidence
#Excise vs. Lump-Sum Taxes
The government also uses taxes to influence markets. An excise tax (or per-unit tax) is a tax on each unit of a good or service produced. A lump-sum tax, on the other hand, is a fixed amount that doesn't depend on the quantity produced. We'll focus on excise taxes here.
Excise taxes shift the supply curve to the left because they increase production costs.
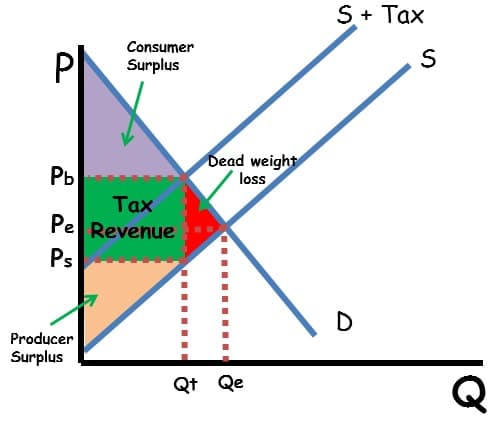
#Graphing Excise Taxes
An excise tax increases production costs, shifting the supply curve to the left. This leads to a new equilibrium with a higher price and lower quantity.
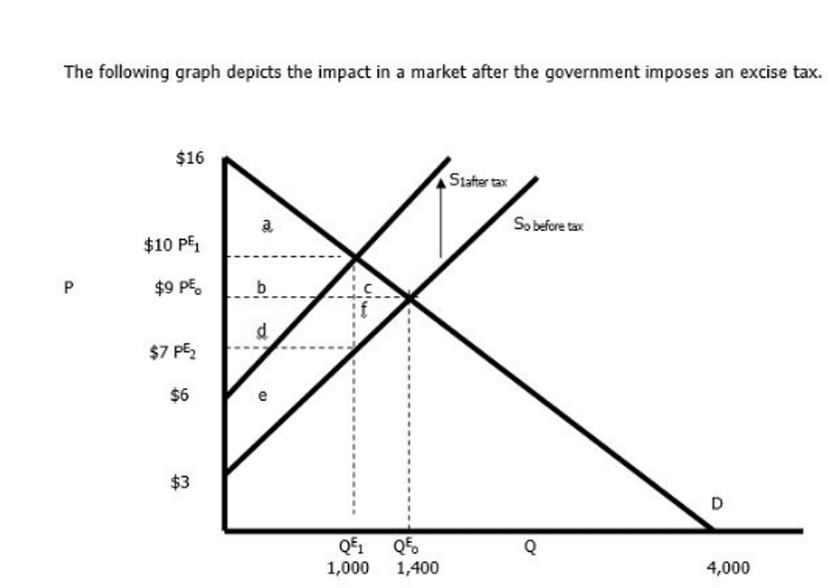
- Graph Explanation:
- The supply curve shifts from S to S+Tax.
- The new equilibrium price is higher, and the quantity is lower.
- Consumer surplus (A) is the area below the demand curve and above the new price.
- Producer surplus (E) is the area above the supply curve and below the price received by producers (after tax).
- Tax revenue (B+D) is the rectangle formed by the tax amount and the new quantity.
- Deadweight loss (C+F) is the triangle showing lost surplus.
#Understanding Tax Incidence
Tax incidence refers to how the burden of a tax is divided between consumers and producers. It's not always a 50/50 split. The relative elasticity of supply and demand determines who bears more of the tax burden.
#Elasticity and Tax Incidence
- Equal Elasticity: If demand and supply have similar elasticity, the tax burden is shared equally.
- Elastic Demand, Inelastic Supply: Producers pay more of the tax because consumers are sensitive to price changes.
- Inelastic Demand, Elastic Supply: Consumers pay more of the tax because producers are sensitive to price changes.
Remember EPIC: Elastic demand, Producers pay more; Inelastic demand, Consumers pay more.


Practice Question
Multiple Choice Questions:
-
Question: An excise tax on a good with perfectly inelastic demand will:
- A) Be paid entirely by producers
- B) Be paid entirely by consumers
- C) Be split equally between producers and consumers
- D) Cause a decrease in the quantity sold Answer: B
-
Question: If the supply of a good is more elastic than the demand, who bears a larger portion of an excise tax?
- A) Consumers
- B) Producers
- C) The government
- D) It is split evenly Answer: A
Free Response Question (FRQ):
Question: Draw a correctly labeled graph of a market for a good. On your graph, show the effect of an excise tax. Identify the areas of consumer surplus, producer surplus, tax revenue, and deadweight loss. Explain how the relative elasticity of demand and supply affects the incidence of the tax.
Scoring Guidelines:
- (1 point) Correctly labeled supply and demand curves.
- (1 point) Equilibrium price and quantity identified.
- (1 point) Supply curve shifted left due to the tax.
- (1 point) New equilibrium price and quantity identified.
- (1 point) Consumer surplus, producer surplus, tax revenue, and deadweight loss identified.
- (1 point) Explanation of how elasticity affects the tax burden (e.g., more inelastic side bears more of the tax).
#Final Exam Focus
- High-Priority Topics:
- Price ceilings and floors (especially their impact on surpluses and shortages).
- Excise taxes and their effects on market equilibrium.
- Tax incidence and the role of elasticity.
- Common Question Types:
- Graphing the effects of price controls and taxes.
- Identifying and calculating consumer surplus, producer surplus, tax revenue, and deadweight loss.
- Explaining how elasticity affects tax incidence.
- Last-Minute Tips:
- Time Management: Quickly identify the type of intervention and draw the relevant graph. Label everything clearly.
- Common Pitfalls: Confusing ceilings and floors, forgetting that non-effective controls have no impact, miscalculating areas on the graph.
- Strategies: Use the EPIC mnemonic for tax incidence. Practice drawing graphs and labeling areas. Read questions carefully to understand what is being asked.
Good luck! You've got this! 💪
Continue your learning journey


How are we doing?
Give us your feedback and let us know how we can improve