Demand
Rachel Carter
8 min read
Listen to this study note
Study Guide Overview
This study guide covers the fundamentals of demand in microeconomics, including: the definition of demand and its relationship to price and quantity; the Law of Demand and its underlying principles (substitution effect, income effect, and diminishing marginal utility); graphing demand curves; the distinction between demand and quantity demanded; factors that shift demand curves (INSECT: Income, Number of Consumers, Substitutes, Expectations, Complements, and Tastes); and practice questions to test comprehension of these concepts.
#AP Microeconomics: Demand - Your Ultimate Guide
Hey there, future AP Micro superstar! Let's break down demand, one of the most fundamental concepts in economics, and get you feeling confident for your exam. Think of this as your go-to resource for all things demand. Let's get started!
#🛒 What is Demand?
In economics, a market is where producers (firms) and consumers (buyers) meet. Demand is all about the consumers—their desire, willingness, and ability to buy goods and services. It's a key factor that drives the market and affects prices. Basically, demand shows the relationship between the quantity of a good consumers are willing and able to buy and the price of that good.
Demand isn't just about wanting something; it's about being able to and willing to pay for it.
#⚖️ The Law of Demand
The Law of Demand is super intuitive: as the price of a good goes up, the quantity demanded goes down, and vice-versa. Think of it like this: if your favorite candy bar suddenly costs twice as much, you'd probably buy fewer, right? This happens because of three main reasons:
- Substitution Effect: When a good gets pricier, people switch to cheaper alternatives. For example, if the price of coffee skyrockets, you might start drinking more tea. ☕
- Income Effect: When prices go up, your purchasing power decreases. You can't buy as much with the same amount of money, so you buy less. If movie tickets cost $20 each, you might choose to watch movies at home instead. 🎬
- Law of Diminishing Marginal Utility: The more you consume of something, the less satisfaction you get from each additional unit. That fifth slice of pizza isn't as amazing as the first.🍕
Think of SID: Substitution, Income, and Diminishing Marginal Utility. These are the three reasons behind the Law of Demand.
These three effects explain why the demand curve slopes downward – a crucial concept for the exam!
#📉 Graphing Demand
When we graph demand, we put quantity on the x-axis and price on the y-axis. This is standard in economics, even though it might seem backward at first. Don't worry, you'll get used to it!
Quantity goes on the x-axis, price on the y-axis. Always!
Since the law of demand tells us that as price decreases, quantity demanded increases, our demand curve is downward sloping. It can be a straight line or a curve, as long as it slopes down.
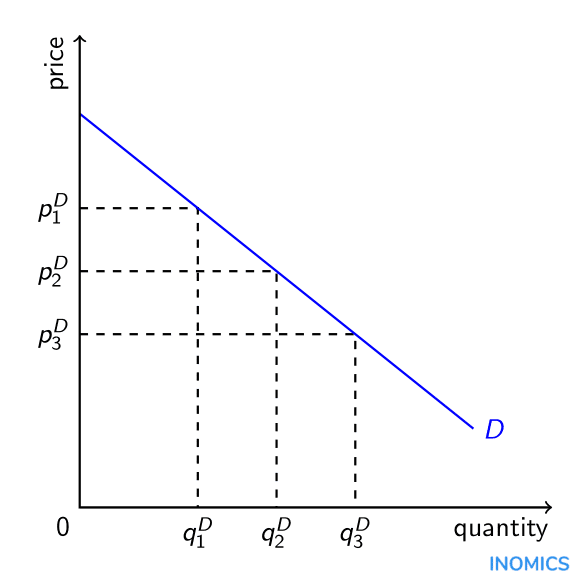
As you can see, at price P1, the quantity demanded is Q1. When the price decreases to P2, the quantity demanded increases to Q2. This is the law of demand in action!
#🧐 Demand vs. Quantity Demanded
It’s easy to mix up demand and quantity demanded, but they're different:
- Demand is the entire relationship between price and quantity. It's the whole curve. Think of it as the overall desire for a good or service at all possible prices.
- Quantity demanded is a specific point on the demand curve. It's how much consumers want to buy at one particular price. It's a single point on the curve.
Confusing demand and quantity demanded is a common mistake! Remember, a change in price only causes a movement along the demand curve (change in quantity demanded), not a shift of the whole curve (change in demand).
Understanding this difference is crucial when we talk about shifters of demand.
#↔️ Shifting Demand
Sometimes, things outside the market change the quantity demanded at every price. This causes the entire demand curve to shift either right (increase in demand) or left (decrease in demand). We use the acronym I-N-S-E-C-T to remember the shifters of demand:
- Income: More income? You might buy more of a good (or less of an inferior good). Less income? You might buy less. 💰
- Number of Consumers: More people in the market? Higher demand. Fewer people? Lower demand. 👪
- Substitutes: If a substitute good becomes cheaper, demand for the original good might decrease. 🔄
- Expectations: If you expect prices to rise, you might buy more now. If you expect a sale, you might wait. 🔮
- Complements: If the price of a complementary good goes up, demand for the original good might go down. (Think hot dogs and hot dog buns.) 🌭
- Tastes: If a product becomes trendy, demand goes up. If it falls out of fashion, demand goes down. 😎
Remember INSECT to recall the shifters of demand: Income, Number of consumers, Substitutes, Expectations, Complements, and Tastes.
- When price level increases, the quantity of a good demanded decreases.
- When price level decreases, the quantity of a good demanded increases.
Determinants are factors that can cause the entire demand curve to increase or decrease. When there is an increase in demand (see graph below), the demand curve will shift right. When at every price level, there is an increase in the quantity demanded. When there is a decrease in demand (see graph below), the demand curve will shift left. At every price level, there is a decrease in quantity demanded.

#🎯 Final Exam Focus
Okay, you've got this! Here's what to focus on for the exam:
- Law of Demand: Make sure you understand why the demand curve slopes downward (substitution effect, income effect, diminishing marginal utility).
- Demand vs. Quantity Demanded: Know the difference! This is a common source of confusion.
- Shifters of Demand (INSECT): Be able to identify how each factor affects demand and be able to shift the curve accordingly.
- Graphing: Practice graphing demand curves and shifting them. This is a visual exam, so get comfortable with graphs!
Demand is a foundational concept. Understanding it well will help you with many other topics in microeconomics.
When answering FRQs, always explain why the demand curve shifts. Don't just say it shifts; explain why using the INSECT framework.
Time Management: Don't spend too long on one question. If you're stuck, move on and come back to it later.
Common Pitfalls: Be careful not to confuse movements along the demand curve with shifts of the curve. Also, make sure you understand the difference between normal and inferior goods when considering income changes.
#📝 Practice Questions
Let's test your knowledge with some practice questions!
Practice Question
Multiple Choice Questions
-
Which of the following would cause a movement along the demand curve for a good? (A) A change in consumer income (B) A change in the price of a substitute good (C) A change in the price of the good itself (D) A change in consumer tastes (E) A change in the number of consumers
-
If the price of a complement to good X increases, what will happen to the demand for good X? (A) Demand will increase (B) Demand will decrease (C) Demand will remain the same (D) The supply of good X will increase (E) The supply of good X will decrease
-
Which of the following best describes the law of demand? (A) As income increases, demand increases (B) As the price of a good increases, the quantity demanded decreases (C) As the price of a good increases, the quantity supplied increases (D) As the price of a good decreases, the quantity supplied decreases (E) As the price of a good increases, the demand increases
Free Response Question
Assume the market for coffee is initially in equilibrium. Draw a correctly labeled graph of the coffee market. Then, show and explain the effect of the following two events on the coffee market:
(a) A decrease in the price of tea (a substitute good). (b) An increase in consumer income, assuming coffee is a normal good.
Scoring Guidelines
(a) Decrease in the price of tea
- (1 point): Correctly labeled graph of the coffee market with supply and demand curves.
- (1 point): A leftward shift of the demand curve for coffee.
- (1 point): Explanation that the decrease in the price of tea (a substitute) will cause consumers to switch to tea, thus decreasing the demand for coffee.
(b) Increase in consumer income (assuming coffee is a normal good)
- (1 point): A rightward shift of the demand curve for coffee.
- (1 point): Explanation that the increase in consumer income will cause an increase in demand for normal goods like coffee.
You've got this! Remember to stay calm, review your notes, and trust your preparation. Good luck on the exam! 🚀
Continue your learning journey


How are we doing?
Give us your feedback and let us know how we can improve