Socially Efficient and Inefficient Market Outcomes
Paul Scott
7 min read
Listen to this study note
Study Guide Overview
This study guide covers socially optimal outcomes in microeconomics. It explains marginal social benefit (MSB) and marginal social cost (MSC), and how their interaction determines allocative efficiency. It discusses market failures due to externalities, focusing on overproduction and underproduction. The guide also provides practice questions and examples involving calculating deadweight loss and analyzing government intervention.
#AP Microeconomics Study Guide: Socially Optimal Outcomes 🚀
#Introduction
In microeconomics, understanding social benefits and social costs is crucial. These concepts help us analyze how production and consumption impact society, not just individuals. For instance, a factory might profit from car production, but the resulting pollution imposes costs on society. This unit explores marginal social benefit (MSB) and marginal social cost (MSC) to evaluate economic efficiency.

Does producing this car help or hurt society? In this unit you'll be able to explain why both may be correct!
# What is a Socially Optimal Outcome?
A socially efficient market outcome is where resources are optimally allocated, considering all internal and external costs and benefits. This occurs when marginal social benefit (MSB) equals marginal social cost (MSC).
# Marginal Social Benefit and Marginal Social Cost

#Marginal Social Benefit (MSB)
Marginal Social Benefit (MSB) is the total additional benefit to society from consuming one more unit of a good or service. This includes both the direct benefits to consumers and the spillover or external benefits to third parties.
The MSB curve slopes downward due to diminishing marginal utility. As consumption increases, the additional satisfaction from each extra unit decreases.
#Marginal Social Cost (MSC)
Marginal Social Cost (MSC) is the total additional cost to society from producing one more unit of a good or service. This includes the private costs to producers and the external costs faced by third parties.
The MSC curve slopes upward because of increasing negative externalities (like pollution) and the rising opportunity cost of using scarce resources.
#Socially Optimal Quantity: MSB = MSC
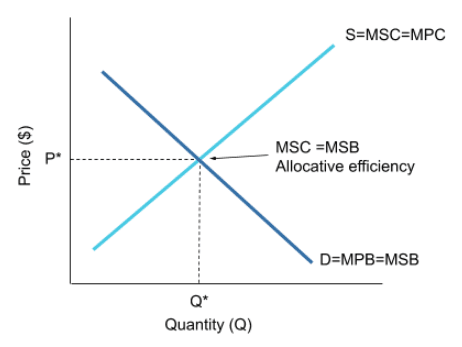
The socially efficient point is where MSB = MSC, maximizing total economic surplus. Producing at any other quantity leads to deadweight loss.
Think of it like a seesaw:
- If MSB > MSC, society benefits more from producing more (underproduction).
- If MSB < MSC, society loses more than it gains from producing more (overproduction).

In the above graph, the intersection of MSC and MSB indicates an efficient allocation of resources. MPC (marginal private cost) and MPB (marginal private benefit) are relevant when there are externalities, where social costs/benefits differ from private ones.
# Inefficient Market Outcomes
Producing at quantities above or below the equilibrium (where MSB=MSC) leads to market failure, where MSB ≠ MSC. This results in either underproduction (excess benefit) or overproduction (excess costs). Governments may intervene to correct these inefficiencies.
For example, consider the market for education:

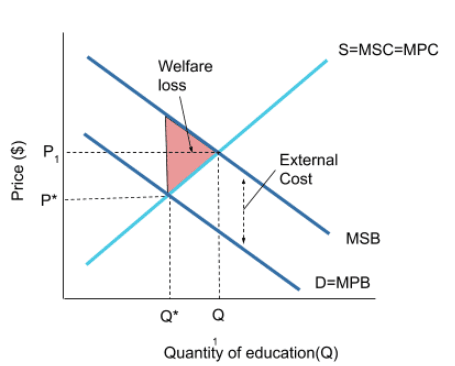
Here, the marginal social benefit (MSB) is greater than the marginal private benefit (MPB). This is a positive externality because education benefits society as a whole. The market will produce at Q*, where supply equals demand, but the socially optimal outcome is at Q, where MSB = MSC. Thus, the market underproduces, leading to deadweight loss.
Remember that market failures often involve externalities, where private costs/benefits don't fully reflect social costs/benefits.
# Final Exam Focus
- Key Concepts: MSB, MSC, Socially Optimal Quantity, Market Failure, Externalities
- Graphing: Be able to identify MSB, MSC, MPC, MPB, and deadweight loss on graphs.
- Application: Understand how externalities lead to under or overproduction and how government intervention can correct these issues.
Don't confuse private and social costs/benefits. Always consider the impact on third parties when analyzing externalities.
Time Management: Quickly identify the type of externality (positive or negative) and whether the market is over or underproducing.
# Practice Questions
Practice Question
Multiple Choice Questions
-
Which of the following best describes the condition for allocative efficiency? (A) Marginal private benefit equals marginal private cost. (B) Marginal social benefit equals marginal social cost. (C) Total private benefit equals total private cost. (D) Total social benefit equals total social cost. (E) Marginal private benefit equals marginal social cost.
-
A negative externality exists when: (A) The social cost of production is less than the private cost. (B) The social cost of production is greater than the private cost. (C) The social benefit of consumption is less than the private benefit. (D) The social benefit of consumption is greater than the private benefit. (E) The private cost of production is greater than the social cost.
-
If the production of a good generates a positive externality, which of the following is true? (A) The market will produce more than the socially optimal quantity. (B) The market will produce less than the socially optimal quantity. (C) The market will produce the socially optimal quantity. (D) The market will produce at a point where marginal private cost exceeds marginal social cost. (E) The market will produce at a point where marginal private benefit equals marginal social cost.
Free Response Question
Assume the market for flu vaccinations is characterized by the following:
- Marginal Private Benefit (MPB) = 10 - Q
- Marginal Private Cost (MPC) = 2 + Q
- Marginal Social Benefit (MSB) = 14 - Q
- Marginal Social Cost (MSC) = MPC
(a) Calculate the market equilibrium quantity and price. (b) Calculate the socially optimal quantity. (c) Calculate the deadweight loss at the market equilibrium. (d) Explain one policy the government could use to correct this market failure.
Answer Key and Scoring Guidelines
(a) Market Equilibrium (2 points)
- Set MPB = MPC: 10 - Q = 2 + Q
- Solve for Q: 2Q = 8, Q = 4
- Substitute Q into either MPB or MPC: P = 10 - 4 = 6 (or P = 2 + 4 = 6)
- Market equilibrium quantity = 4, price = 6
(b) Socially Optimal Quantity (2 points)
- Set MSB = MSC: 14 - Q = 2 + Q
- Solve for Q: 2Q = 12, Q = 6
- Socially optimal quantity = 6
(c) Deadweight Loss (3 points)
- Identify the underproduced quantity: 6 - 4 = 2
- Find the difference between MSB and MSC at the market quantity (Q=4):
- MSB at Q=4: 14 - 4 = 10
- MSC at Q=4: 2 + 4 = 6
- Difference: 10 - 6 = 4
- Calculate the area of the deadweight loss triangle: 0.5 * 2 * 4 = 4
- Deadweight loss = 4
(d) Policy (2 points)
- Explain that a subsidy could be used to increase the quantity of vaccinations.
- The subsidy should be equal to the external benefit at the socially optimal quantity (Q=6). The external benefit is the difference between MSB and MPB at Q=6, which is (14-6) - (10-6) = 8-4 = 4. Therefore, a subsidy of 4 per vaccination would shift the MPB curve to the MSB curve.
Answers to Multiple Choice Questions
- B
- B
- B
Continue your learning journey

How are we doing?
Give us your feedback and let us know how we can improve


