Competing Function Model Validation
Alice White
7 min read
Listen to this study note
Study Guide Overview
This study guide covers model validation by focusing on linear, quadratic, and exponential functions. It explains how to choose the appropriate model based on data patterns and rate of change. It also teaches how to evaluate model fit using residuals, distinguishing between random scatter (good fit) and patterns (bad fit). Finally, it discusses errors, including overestimation and underestimation, and their real-world implications.
#AP Pre-Calculus: Model Validation - Your Night-Before-the-Exam Guide 🚀
Hey! Let's make sure you're feeling super confident about model validation. It might sound intimidating, but it's all about choosing the right function and making sure it fits the data well. Let’s break it down!
#
2.6: Competing Function Model Validation
This section is all about building and checking models. We're going to see how to create linear, quadratic, and exponential models from data, and then how to check if the model is actually a good fit. Think of it as becoming a data detective! 🕵️
# 😵💫 Linear, Quadratic, or Exponential Models?
When you're given a set of data, you need to figure out what kind of function best describes it. Here's a quick rundown:
-
Linear Functions:
- Form:
- Key Feature: Constant rate of change (the slope is the same everywhere).
- Best For: Data that shows a straight-line pattern.
- Think: A car moving at a constant speed. 🚗
-
Exponential Functions:
- Form:
- Key Feature: Changing rate of change. The rate depends on the base 'b'.
- Best For: Data that shows growth or decay patterns.
- Think: Population growth or radioactive decay. ⤴️
-
Quadratic Functions:
- Form:
- Key Feature: Changing rate of change. The rate depends on the coefficient 'a'.
- Best For: Data that shows a parabolic (U-shaped) pattern.
- Think: The path of a ball thrown in the air. ☂️
Quick Tip: Look at the data's rate of change. Is it constant (linear), increasing/decreasing (exponential), or changing direction (quadratic)? This is your first clue!
Memory Aid: Think of the shapes! Linear is a line, exponential is a curve, and quadratic is a U or an upside-down U. Visualize it! 🪁
# 🧐 Appropriateness of Model
So, you've made a model. Now, is it any good? Here’s how to check:
-
Residuals: These are the differences between your model's predictions and the actual data values. 💯

Caption: Residuals show the difference between the actual data points and the predicted values from the model.
-
What to Look For:
-
Good Model: Residuals are randomly scattered around zero. No pattern! 🎉

Caption: A good residual plot shows random scatter around zero.
-
Bad Model: Residuals show a pattern (like a curve or a line). 😔

Caption: A bad residual plot shows a clear pattern, indicating the model is not a good fit.
-
Key Point: A good model has residuals that look like random noise. If you see a pattern, your model needs work! 💡
# 😣 Errors
-
Error: The difference between the predicted and actual values. Basically, how much your model got it wrong. 🚨
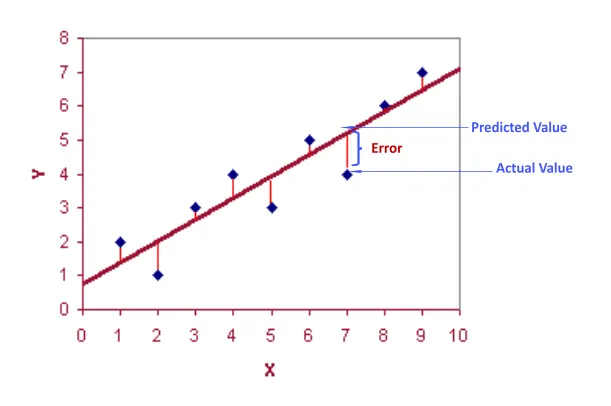
Caption: The error is the vertical distance between the actual data point and the predicted value on the line.
-
Underestimate vs. Overestimate:
- Sometimes, it's better for your model to predict higher than the actual value (overestimate).
- Other times, it's better to predict lower (underestimate). It depends on the situation.
- Example: Overestimating hospital resources is better than underestimating. Underestimating bank balance is better than overestimating. 👈🏼
Common Mistake: Forgetting that the context of the problem matters! Always think about what an over or under prediction means in the real world. 🎯
#Final Exam Focus
Okay, here's what to really focus on for the exam:
- Model Types: Be able to quickly identify if data looks linear, exponential, or quadratic.
- Residuals: Know how to interpret a residual plot. Random scatter = good model. Pattern = bad model.
- Error: Understand what error is and when it's better to over or under predict.
Time Management: On the exam, quickly sketch the data and think about the general shape before jumping into calculations. This can save you time and prevent errors.
# Practice Questions
Here are a few practice questions to get you ready:
Practice Question
Multiple Choice Questions:
-
A set of data is modeled by the function . Which of the following best describes the pattern of the residuals if the model is a good fit? (A) The residuals will form a parabola. (B) The residuals will form a straight line. (C) The residuals will be randomly scattered around zero. (D) The residuals will show an exponential growth pattern.
-
A data set shows a constant rate of change. Which type of function would be most appropriate to model this data? (A) Exponential (B) Quadratic (C) Linear (D) Sinusoidal
-
A residual plot shows a clear curved pattern. What does this indicate about the model? (A) The model is a good fit for the data. (B) The model is not a good fit for the data. (C) The model is perfect, and no changes are needed. (D) The model is only appropriate for a small range of data.
Free Response Question:
A group of students is conducting an experiment to study the growth of a bacteria population. They record the following data:
| Time (hours) | Population |
|---|---|
| 0 | 100 |
| 1 | 200 |
| 2 | 400 |
| 3 | 800 |
| 4 | 1600 |
(a) Determine the type of function (linear, quadratic, or exponential) that would best model this data. Justify your choice. (2 points)
(b) Write an equation for the function that models the data. (3 points)
(c) Calculate the predicted population at 2.5 hours using your model. (1 point)
(d) Suppose the actual population at 2.5 hours was 500. Calculate the residual at this point. (1 point)
(e) What does the sign of the residual tell you about your model's prediction at 2.5 hours? (1 point)
Answer Key:
Multiple Choice:
- (C)
- (C)
- (B)
Free Response Question:
(a) Exponential. The population is doubling every hour, indicating a constant percentage increase, which is characteristic of exponential growth. (2 points)
(b) (3 points)
(c) (1 point)
(d) Residual = Actual - Predicted = 500 - 565.69 = -65.69 (1 point)
(e) The negative residual indicates that the model overestimated the population at 2.5 hours. (1 point)
You've got this! Go crush that exam! 💪
Continue your learning journey


How are we doing?
Give us your feedback and let us know how we can improve