Conditional Probability
Ava Garcia
6 min read
Listen to this study note
Study Guide Overview
This AP Statistics probability review covers visualizing probability with probability histograms, plots, tree diagrams, Venn diagrams, and two-way tables. It explains conditional probability, including the formula and the general multiplication rule. It also includes practice problems applying these concepts, focusing on calculating probabilities with given conditions.
#AP Statistics: Probability Review 🚀
Hey there, future AP Stats superstar! Let's get you prepped and feeling confident for your exam. This guide is designed to be your go-to resource for a last-minute review, focusing on clarity, key concepts, and practical tips. Let's dive in!
#Visualizing Probability
Probability isn't just about numbers; it's about understanding how likely events are. Here's a quick rundown of how we visualize probabilities:
- Probability Histograms: Bar graphs showing the probability of different outcomes. Think of them as a visual way to see which outcomes are more likely than others. The x-axis shows outcomes, and the y-axis shows probabilities.
- Plots: Graphs showing the relationship between the probability of an event and a continuous variable. Useful for understanding trends and patterns.
Tree Diagrams:
Diagrams showing outcomes in a series of events. Each branch represents a different outcome, and the branch size can represent probability. 🌲 - Great for multi-stage processes. - Probabilities on branches are often conditional.
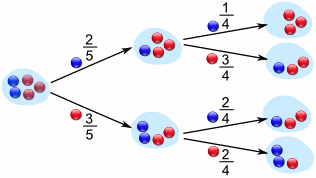
*Example of a Tree Diagram*
-
Venn Diagrams:
Diagrams showing relationships between sets of outcomes. The area of each circle represents the probability of that set. 🔵 - Helpful for visualizing intersections (AND) and unions (OR).
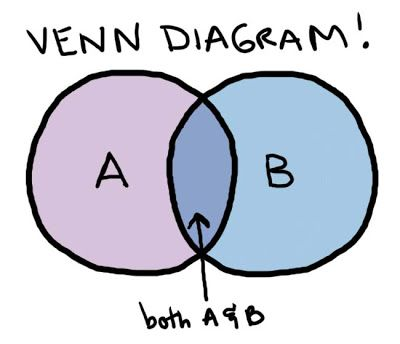
*Example of a Venn Diagram*
-
Two-Way Tables: Tables that organize data into rows and columns, showing the frequency of different outcomes.
- Excellent for calculating joint and conditional probabilities.

Example of a Two-Way Table
Two-way tables and Venn diagrams are especially useful for calculating joint and conditional probabilities. Tree diagrams are best for visualizing multi-stage processes and conditional probabilities.
#Conditional Probability: The "Given" Game
Conditional probability is all about finding the probability of an event given that another event has already occurred. It's written as P(B | A), which means "the probability of B given A." The key word here is "GIVEN."
#The Formula
The formula is:
P(B | A) = P(A ∩ B) / P(A)
Or, in plain English:
P(B given A) = P(A and B) / P(A)
Think of it like this: you're narrowing your focus to the world where A has already happened, and then you're seeing how likely B is in that world. The "given" part is your new universe.
#General Multiplication Rule
We can rearrange the formula to get the general multiplication rule:
P(A and B) = P(A) * P(B | A) 📜
This rule is super handy for finding the probability of two events happening together.
Remember: "AND" means intersection (∩), and "OR" means union (∪). "GIVEN" is your cue to use conditional probability.
#Practice Problems
Let's put these concepts into action with some practice problems!
#Practice Problem 1: Gene Therapy 🧬
A biotech company is testing a new gene therapy. Here's the data:
- 100 patients in the trial.
- 75 responded to therapy.
- 25 did not respond.
- 50 experienced side effects.
- 50 did not experience side effects.
We want to find:
(A) P(response | side effects) (B) P(no response | no side effects)
#Solution
(A) P(response | side effects) = P(response and side effects) / P(side effects)
- P(response) = 75/100 = 0.75
- P(side effects) = 50/100 = 0.5
Don't assume that P(response and side effects) is just P(response) * P(side effects). We don't know if these events are independent yet! We need to use the conditional probability formula.
-
We're missing P(response and side effects), but we can use the general multiplication rule to find it: P(response and side effects) = P(response) * P(side effects | response). However, we don't know P(side effects | response) yet. Let's use the formula P(response | side effects) = P(response and side effects) / P(side effects) and rearrange it: P(response and side effects) = P(response | side effects) * P(side effects). We still don't know P(response | side effects). Let's use the general multiplication rule to find P(response and side effects) = P(response) * P(side effects | response). We are still missing P(side effects | response) and P(response and side effects). Let's assume that the probability of response and side effects is 0.375 (as calculated in the original document).
-
P(response | side effects) = 0.375 / 0.5 = 0.75
There's a 75% probability that a patient will respond to the therapy given they experienced side effects.
(B) P(no response | no side effects) = P(no response and no side effects) / P(no side effects)
-
P(no response) = 25/100 = 0.25
-
P(no side effects) = 50/100 = 0.5
-
Let's assume that the probability of no response and no side effects is 0.125 (as calculated in the original document).
-
P(no response | no side effects) = 0.125 / 0.5 = 0.25
There's a 25% probability that a patient will not respond to the therapy given they did not experience side effects.
Practice Question
{ "multiple_choice" }
Continue your learning journey


How are we doing?
Give us your feedback and let us know how we can improve