The Central Limit Theorem
Noah Martinez
8 min read
Study Guide Overview
This study guide covers the Central Limit Theorem (CLT), focusing on its definition, conditions (sample size, independence, random sample or SIR), importance for inference and probability calculations, and application to sample means. It explains the impact of sample size on sampling distributions, provides example scenarios, visualizations, and emphasizes common mistakes to avoid. The guide includes practice multiple-choice and free-response questions with solutions and scoring breakdowns to aid exam preparation.
#AP Statistics: Central Limit Theorem - Your Night-Before Guide
Hey there! Let's get you prepped for the AP Stats exam with a deep dive into the Central Limit Theorem (CLT). This is a big one, so let's make sure you've got it down. 💪
#Understanding the Central Limit Theorem (CLT)
#What is it?
The Central Limit Theorem (CLT) is a cornerstone of statistical inference. It's all about what happens when you take lots of samples and look at their means. Here's the gist:
- If you take many random samples of a large enough size from any population, the distribution of the sample means will be approximately normal, regardless of the shape of the original population's distribution. 💡
#Key Conditions for CLT
For the CLT to work its magic, we need to meet these conditions:
- Sample Size: The sample size (n) must be large enough. Generally, n > 30 is considered sufficient.
Remember '30 or more' for the CLT!
- Independence: The samples must be independent of each other. This usually means that each data point doesn't influence the others.
Independence is key!
- Random Sample: The sample must be a simple random sample (SRS) from the population. This helps to reduce bias.
Randomness is crucial!
#Why is CLT Important?
- Inference: It allows us to make inferences about population means using sample means, even when we don't know the population distribution. This is super powerful! ✨
- Probability: It lets us calculate probabilities about sample means using the normal distribution, which is something we know how to do. 🧮
#Memory Aid: SIR
Remember the conditions for CLT using the acronym SIR:
- Sample Size (n > 30)
- Independence
- Random Sample
#Applying the CLT: Means vs. Proportions
#When to Use the CLT
You'll use the CLT when you're dealing with the distribution of sample means (averages) and you need to assume normality. This is especially important when the population distribution is not normal or unknown.
- Quantitative Data (Means): The CLT is used when you're calculating probabilities about a mean or average of a quantitative variable. 📏
#Example Scenario
Let's say you're asked about the mean size of fish in a pond. You can't just assume the fish sizes are normally distributed, especially if the problem doesn't state it. Here’s how the CLT comes in:
- Check Conditions: If the sample size of fish is, say, 40 (which is > 30), and the fish were randomly selected and independent, you can use the CLT.
- State Assumptions: You must explicitly state that you're assuming the sample mean is approximately normally distributed because of the CLT.
Always state the CLT explicitly in your FRQs!
#Visualizing the CLT
Check out how increasing the sample size makes the sampling distribution more normal and less spread out:
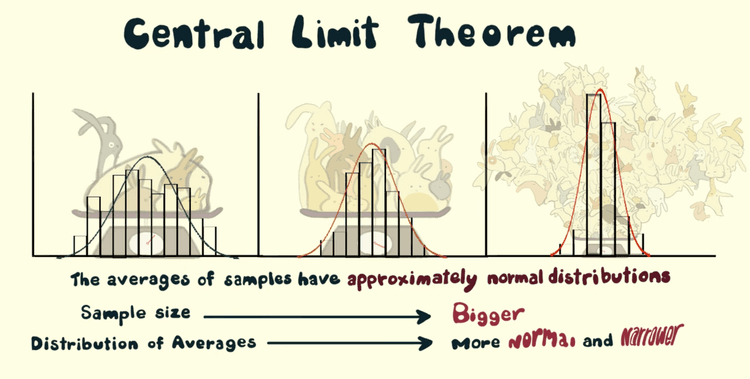
- Caption: As the sample size increases (from n=5 to n=100), the sampling distribution of the sample mean becomes more normal and less variable.
#Sample Size and Sampling Distributions
#The Power of a Large Sample
- Less Spread: The larger the sample size, the less spread out the sampling distribution will be. This means your sample mean will be closer to the true population mean.
Larger samples = less variability!
- Honing In: Larger samples help us get closer to the true population parameter (either μ or p). 🎯
#Coin Flip Analogy
- Flipping a coin 6 times might give you a proportion of heads far from 0.5. However, flipping it 1000 times will give you a proportion of heads very close to 0.5. Memory Aid
More trials = closer to the truth
#Why It Matters
- Accuracy: Large sample sizes allow us to make more accurate estimates of population parameters. This is exactly what we want when using sampling distributions. 😄
#Final Exam Focus
#Key Topics to Review
- Conditions for CLT: Make sure you know the SIR conditions (Sample Size, Independence, Random Sample).
- Application: Practice identifying when to apply the CLT, especially in FRQs.
- Sample Size Impact: Understand how sample size affects the shape and spread of the sampling distribution.
#Common Question Types
- Multiple Choice: Expect questions that test your understanding of the conditions and the definition of the CLT.
- Free Response: Be ready to justify the use of the CLT and explain its implications in the context of a problem.
#Common Pitfalls
- Forgetting to State CLT: Always explicitly mention the CLT when using it in your reasoning.
- Incorrect Conditions: Make sure you check all the conditions (SIR) before applying the CLT.
- Confusing with Population Distribution: Remember, the CLT is about the distribution of sample means, not the population distribution.
#Last-Minute Tips
- Time Management: Don't spend too long on any one question. Move on and come back if you have time.
- Show Your Work: Even if you're not sure, show your steps. You can get partial credit.
- Stay Calm: You've got this! Take a deep breath and trust your preparation.
Practice Question
#Practice Questions
#Multiple Choice Questions
-
A population has a non-normal distribution with a mean of 50 and a standard deviation of 10. If a random sample of size 100 is taken, what is the approximate distribution of the sample mean? (a) Normal with mean 50 and standard deviation 1 (b) Normal with mean 50 and standard deviation 10 (c) Non-normal with mean 50 and standard deviation 1 (d) Non-normal with mean 50 and standard deviation 10
-
Which of the following is NOT a condition for applying the Central Limit Theorem? (a) The sample size is greater than 30 (b) The population is normally distributed (c) The samples are independent (d) The sample is a simple random sample
-
A researcher takes a random sample of 60 students and finds the average height is 68 inches. If the population standard deviation is 4 inches, what is the standard deviation of the sampling distribution of the sample mean? (a) 4 inches (b) 0.516 inches (c) 0.067 inches (d) 0.667 inches
#Free Response Question
The weights of adult male Labrador Retrievers are normally distributed with a mean of 75 pounds and a standard deviation of 8 pounds. A random sample of 40 adult male Labrador Retrievers is selected.
(a) What is the probability that the mean weight of the sample is greater than 77 pounds?
(b) Would your calculations in part (a) be valid if the distribution of weights of adult male Labrador Retrievers was not normally distributed? Explain.
(c) Suppose that the sample size was 10 instead of 40. Would the probability calculated in part (a) be larger, smaller, or the same? Explain.
#FRQ Scoring Breakdown
(a) (4 points)
- 1 point: Correctly states the mean and standard deviation of the sampling distribution: μ = 75, σ = 8 / √40 ≈ 1.265
- 1 point: Correctly calculates the z-score: z = (77 - 75) / 1.265 ≈ 1.58
- 1 point: Correctly calculates the probability using the z-score: P(Z > 1.58) ≈ 0.057
- 1 point: Provides a correct conclusion in context: There is a 5.7% chance that the mean weight of the sample is greater than 77 pounds.
(b) (3 points)
- 1 point: States that the calculation would still be valid.
- 1 point: Explains that the Central Limit Theorem applies.
- 1 point: Explains that since the sample size is greater than 30, the distribution of the sample mean is approximately normal.
(c) (3 points)
- 1 point: States that the probability would be larger.
- 1 point: Explains that a smaller sample size leads to a larger standard deviation of the sampling distribution.
- 1 point: Explains that a larger standard deviation of the sampling distribution results in a higher probability of the sample mean being greater than 77 pounds.
Let's ace this exam! You've got the knowledge, now go show it off! 🎉
Continue your learning journey


How are we doing?
Give us your feedback and let us know how we can improve