Sampling Distributions for Differences in Sample Proportions
Jackson Hernandez
9 min read
Listen to this study note
Study Guide Overview
This study guide covers comparing two proportions, focusing on calculating the standard deviation of the difference. It emphasizes the importance of adding variances, using the formula (provided), and checking the Large Counts Condition. It also reviews sampling distributions, the Central Limit Theorem (CLT), common mistakes, and includes practice problems and exam tips covering confidence intervals and hypothesis tests.
#AP Statistics: Differences in Proportions - The Night Before 🌃
Hey! Let's get you ready for the AP Stats exam. We're focusing on comparing proportions today, a key area where you can really shine. Remember, it's all about understanding the why behind the formulas, not just memorizing them. Let's dive in!
#Comparing Two Proportions
#Differences (Non-Distribution) Recap
When we're dealing with differences in sample proportions or means, remember this golden rule: variances ALWAYS add. ➕ This is crucial! If you need the standard deviation, just take the square root of the combined variance. For means, you can subtract them directly, but variances always add. It's a little quirky, but that's statistics for you! 😉
#Proportion Differences
When comparing two proportions, we're essentially looking at the difference between two sample groups. Here's how to find the standard deviation of that difference:
-
Variance Addition: If you have standard deviations, square them first to get variances. Then, add these variances. 📐 This is often called the "Pythagorean Theorem of Statistics" because it looks like the Pythagorean theorem, but it's for variances.
-
Standard Deviation: Take the square root of the sum of the variances to get the standard deviation of the difference.
Here's the formula, straight from the AP Stats formula sheet:
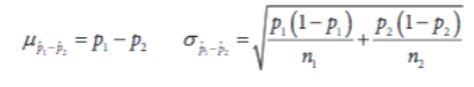
*Caption: The formula for the standard deviation of the difference between two sample proportions. Notice how the variances are added before taking the square root.*
*Caption: Another view of the standard deviation formula. Remember, this is for the sampling distribution of the difference in proportions.*
Large Counts Condition: For any proportion inference, you MUST check the Large Counts condition to confirm normality. This means verifying that:
- Remember, the Central Limit Theorem (CLT) only applies to means (quantitative data), not proportions (categorical data).
#Sampling Distribution of the Difference in Proportions
When you randomly sample with replacement from two independent populations, the sampling distribution of the difference in sample proportions () has:
- Mean: (the difference of the population proportions)
- Standard Deviation: As calculated above (using the formula).
Also, this sampling distribution will be approximately normal if the sample sizes are large enough (as verified by the Large Counts condition).
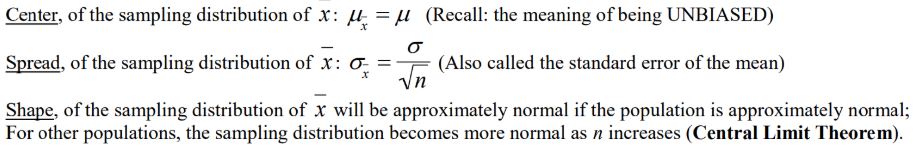
Here’s a quick **review** of types of distributions: ⭐
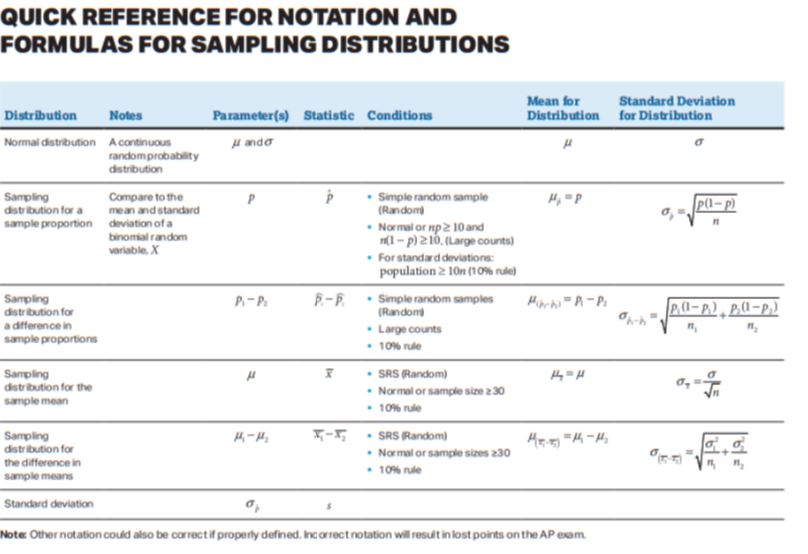
*Caption: A quick review of different distribution types. Keep this handy!*
Memory Aid: Think of the standard deviation formula as the "Pythagorean Theorem of Statistics"—square the standard deviations (or use the term), add them, then take the square root. It's all about adding the variances first!
#Practice Problem
Let's solidify these concepts with a real-world example. Imagine you're comparing support for a new public transportation system in two cities. 🚂
Scenario: You survey 1000 people in each city (City A and City B) and find that 600 in City A and 700 in City B support the system.
a) Calculate the sample proportions of supporters in each city. b) Explain what the sampling distribution for the difference in sample proportions represents. c) If the true population proportion of support is 0.6 in City A and 0.7 in City B, describe the sampling distribution for the difference in sample proportions. d) Explain why the Central Limit Theorem (CLT) applies here. e) Discuss a potential source of bias.
#Answer
a)
- City A:
- City B:
b) The sampling distribution shows all possible differences in sample proportions you could get if you repeated the study many times. It helps us make inferences about the true difference in support between the cities.
c) The sampling distribution would be approximately normal, centered at . The spread would depend on the sample sizes and the variability in the populations.
d) The Central Limit Theorem (CLT) applies because our sample sizes are large (n=1000 for both cities), so the sampling distribution of the difference in sample proportions will be approximately normal, regardless of the shape of the original populations.
e) Nonresponse bias could occur if certain groups are more or less likely to respond. For example, if supporters in City A are more likely to respond, our sample proportion may be an overestimate of the true population proportion. Similarly, if non-supporters in City B are more likely to respond, our sample proportion may be an underestimate of the true population proportion.
Practice Question
#Practice Questions
Multiple Choice Questions
-
A researcher is studying the effectiveness of a new drug to treat a certain condition. In a clinical trial, 300 patients are randomly assigned to receive either the new drug or a placebo. The proportion of patients who show improvement after one month is compared between the two groups. Which of the following is the most appropriate test to use for this comparison? (A) A one-sample z-test for a proportion (B) A two-sample z-test for proportions (C) A one-sample t-test for a mean (D) A two-sample t-test for means (E) A chi-square test for independence
-
Two independent random samples are taken from two populations. The first sample has a size of 100 with a sample proportion of 0.6. The second sample has a size of 200 with a sample proportion of 0.4. What is the standard error of the sampling distribution of the difference in sample proportions? (A) 0.023 (B) 0.041 (C) 0.053 (D) 0.065 (E) 0.072
-
A survey is conducted to compare the proportion of adults who support a certain policy in two different cities. In City A, 400 out of 1000 adults support the policy. In City B, 500 out of 1200 adults support the policy. Which of the following is the point estimate for the difference in proportions of adults who support the policy between the two cities (City A - City B)? (A) -0.017 (B) 0.017 (C) 0.083 (D) 0.100 (E) 0.900
Free Response Question
A study was conducted to compare the effectiveness of two different treatments for a medical condition. A total of 400 patients were randomly assigned to one of two groups: Group A received Treatment A, and Group B received Treatment B. The results are summarized below:
| Group | Number of Patients | Number of Patients with Improvement |
|---|---|---|
| Treatment A | 200 | 140 |
| Treatment B | 200 | 120 |
(a) Calculate the sample proportion of patients who showed improvement in each group.
(b) Calculate the standard error of the sampling distribution of the difference in sample proportions.
(c) Construct a 95% confidence interval for the difference in population proportions. Show all your work.
(d) Based on the confidence interval, is there evidence to suggest a significant difference in the effectiveness of the two treatments? Explain.
Scoring Guidelines
(a)
- Correctly calculates the sample proportion for Treatment A: 140/200 = 0.7 (1 point)
- Correctly calculates the sample proportion for Treatment B: 120/200 = 0.6 (1 point)
(b)
- Correctly calculates the standard error: (2 points: 1 for formula, 1 for correct calculation)
(c)
- Uses the correct critical value for a 95% confidence interval (z* = 1.96) (1 point)
- Calculates the margin of error: 1.96 * 0.0458 = 0.0898 (1 point)
- Correctly constructs the confidence interval: (0.7 - 0.6) ± 0.0898 = (0.0102, 0.1898) (1 point)
(d)
- Correctly states that since the confidence interval does not contain zero, there is evidence to suggest a significant difference in the effectiveness of the two treatments (1 point)
- Provides a reasonable explanation (1 point)
#Final Exam Focus
Okay, you've made it this far! Here's what to focus on for the exam:
-
High-Priority Topics: Inference for proportions, especially comparing two proportions. Make sure you understand the conditions for inference (Random, Independent, Large Counts).
- Common Question Types: Expect questions that ask you to calculate standard errors, construct confidence intervals, and perform hypothesis tests for differences in proportions. Also, be prepared to interpret your results in context.
- Common Mistakes: Watch out for mixing up standard deviations and variances. Remember, variances always add! Also, make sure to check the Large Counts condition before performing inference.
Quick Fact: The "Pythagorean Theorem of Statistics" is your friend for adding variances. Always add variances, never standard deviations directly!
You've got this! Go into the exam with confidence, and remember everything you've learned. You're ready to rock this! 🎉
Continue your learning journey


How are we doing?
Give us your feedback and let us know how we can improve