Setting Up a Test for the Difference of Two Population Proportions
Isabella Lopez
10 min read
Listen to this study note
Study Guide Overview
This study guide covers two-proportion z-tests for comparing two population proportions. It explains hypotheses (null and alternative), parameters, and the necessary conditions for inference (random, independent, normal). It details the pooled proportion calculation, the large counts condition, calculating the test statistic and p-value, and interpreting results in context. Practice questions and an answer key are included.
#AP Statistics: Two-Proportion Z-Test Study Guide 🚀
Hey there, future AP Stats superstar! Let's get you prepped for the exam with a focused review of the two-proportion z-test. This guide is designed to be your go-to resource for a quick, effective review. Let's dive in!
#
Significance Tests for Two Proportions
A significance test helps us determine if the difference between two sample proportions is statistically significant, or just due to random chance. It's all about seeing if there's a real difference between two groups. Think of it as a detective tool for data! 🕵️♀️
#
Core Idea
- We're comparing two population proportions (p1 and p2) to see if there’s a genuine difference.
- We use sample data to make inferences about the population.
- The goal is to decide whether observed differences are statistically significant or just due to chance.
# Hypotheses and Parameters
- Null Hypothesis (H0): There is no difference between the two population proportions. Always written as
- Alternative Hypothesis (Ha): There is a difference. This can be one-sided ( or ) or two-sided ().
- Parameters: Clearly define what and represent in the context of the problem. For example, = proportion of people who prefer Brand A, = proportion of people who prefer Brand B.

Remember: The null hypothesis always assumes no difference (). The alternative hypothesis is what you're trying to find evidence for (either or ).
# Conditions for Inference
Before we jump into calculations, we need to make sure our data is good to go. Here are the conditions we need to check:
#(1) Random
- Samples must be randomly selected from their respective populations. This is crucial for avoiding bias. If it's not random, your results can't be generalized to the population. 😞
#(2) Independence
- **10% Condition:** Both populations must be at least 10 times larger than their respective samples. This ensures that the samples are independent. 🔟
- **Random Assignment:** If it's a randomized experiment, the random assignment of treatments ensures independence.
#(3) Normal
- **Large Counts Condition:** We need to check if our expected successes and failures are at least 10. But here's the twist: we use a *pooled* proportion (<math-inline>\hat{p}\_c</math-inline>) to calculate these expected values. 🎩

- Pooled Proportion Formula: , where and are the number of successes in each sample, and and are the sample sizes.

-
Check: , , , and
Think of it like a swimming pool: We're combining our two samples into one big pool to get a better estimate of the overall proportion. 🏊
#Example: MJ vs. Lebron (Again!) 🏀
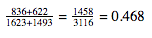
Let's revisit our basketball legends. MJ made 836/1623 shots, and Lebron made 622/1493 shots. Let's use a 2-Prop Z-Test.
#Hypotheses and Parameters
- Where is the proportion of shots made by MJ, and is the proportion of shots made by Lebron.

Use meaningful subscripts (like MJ and L) to keep track of which proportion belongs to which group. It makes everything clearer!
#Conditions
- Random: Assume the shots are random (even though it wasn't explicitly stated).
- Independent: Assume MJ took at least 16,230 shots and Lebron took at least 14,930 shots, so the samples are independent.
- Normal:
- Calculate the pooled proportion:
    - Check large counts:
        - <math-inline>1623(0.468) = 759.6 > 10</math-inline> ✔️
        - <math-inline>1623(0.532) = 863.4 > 10</math-inline> ✔️
        - <math-inline>1493(0.468) = 698.7 > 10</math-inline> ✔️
        - <math-inline>1493(0.532) = 794.3 > 10</math-inline> ✔️
#
Test Statistic and P-value
- Test Statistic: Calculate the z-score using the formula:
- P-value: Find the probability of getting a z-score as extreme as the one you calculated, assuming the null hypothesis is true. Use your calculator or a z-table.
#Conclusion
- Decision: If the p-value is less than your significance level (usually ), reject the null hypothesis. There is significant evidence to support the alternative hypothesis.
- Context: Always state your conclusion in the context of the problem. Don't just say "reject the null." Explain what that means in real-world terms. 🧪
#Final Exam Focus
- High-Priority Topics:
- Hypotheses (null and alternative), parameters definition
- Conditions for inference (random, independent, normal)
- Pooled proportion calculation and large counts condition
- Interpreting p-values and making conclusions in context
- Common Question Types:
- Multiple choice questions testing conceptual understanding of hypothesis testing and conditions.
- Free response questions requiring you to perform a full significance test, including stating hypotheses, checking conditions, performing calculations, and writing a conclusion in context.
- Time Management:
- Quickly identify the type of test needed (two-proportion z-test).
- Focus on correctly stating hypotheses and checking conditions first.
- Use calculator shortcuts to find test statistics and p-values.
- Common Pitfalls:
-
Forgetting to define parameters.
-
Incorrectly checking the normal condition (not using the pooled proportion).
-
Misinterpreting the p-value or not stating the conclusion in context.
-
Remember: It's not just about getting the right answer; it's about showing your understanding of the process. Always show your work and explain your reasoning.
#
Practice Question
Practice Questions
#Multiple Choice Questions
-
A researcher is testing the effectiveness of a new drug. In a randomized experiment, 200 patients are given the new drug, and 200 are given a placebo. The proportion of patients who showed improvement was 0.65 in the drug group and 0.55 in the placebo group. Which of the following is the correct set of hypotheses for a two-proportion z-test? (A) , (B) , (C) , (D) , (E) ,
-
A survey was conducted to compare the proportions of adults who support a new policy in two different cities. In City A, 150 out of 250 adults supported the policy, while in City B, 120 out of 200 adults supported the policy. Before performing a two-proportion z-test, what condition must be checked regarding the sample sizes? (A) The sample sizes must be equal. (B) Both sample sizes must be greater than 30. (C) The populations must be at least 10 times the sample sizes. (D) The sample proportions must be approximately normal. (E) The sample sizes must be less than 10% of the population.
-
When conducting a two-proportion z-test, why is a pooled proportion used when checking the normal condition? (A) To simplify calculations. (B) To account for the difference in sample sizes. (C) Because the null hypothesis assumes the two population proportions are equal. (D) To increase the power of the test. (E) To reduce the chance of a Type I error.
#Free Response Question
A study was conducted to investigate the effectiveness of a new teaching method. A group of 100 students were randomly assigned to either the new method or the traditional method. After a semester, the proportion of students who passed the final exam was recorded for each group. 70 out of 100 students using the new method passed the exam and 60 out of 100 using the traditional method passed the exam. Conduct a significance test to determine if there is evidence that the new method is more effective than the traditional method. Use a significance level of .
Scoring Rubric:
(a) Hypotheses and Parameters (1 point): - 1 point for stating correct null and alternative hypotheses with proper notation. - 1 point for defining the parameters in context.
(b) Conditions (3 points): - 1 point for stating random sample/assignment condition. - 1 point for stating the independence condition and verifying it. - 1 point for stating and verifying the normal condition using the pooled proportion.
(c) Calculations (2 points): - 1 point for calculating the test statistic. - 1 point for calculating the p-value.
(d) Conclusion (1 point): - 1 point for making a correct conclusion in context, based on the p-value and significance level.
Answer Key:
Multiple Choice:
- (B)
- (C)
- (C)
Free Response:
(a) Hypotheses and Parameters: - - - Where is the proportion of students who pass the exam using the new method and is the proportion of students who pass the exam using the traditional method.
(b) Conditions: - Random: The problem states that students were randomly assigned, so the random condition is met. - Independent: Since the sample size is 100 in each group, and it is reasonable to assume that there are more than 1000 students, the 10% condition is met. - Normal: - - - - -
(c) Calculations: - Test Statistic: - P-value:
(d) Conclusion: - Since the p-value (0.0655) is greater than the significance level (0.05), we fail to reject the null hypothesis. There is not enough evidence to conclude that the new teaching method is more effective than the traditional method.
You've got this! Keep practicing, stay confident, and you'll ace that exam. Good luck! 🌟
Continue your learning journey


How are we doing?
Give us your feedback and let us know how we can improve