Confidence Intervals for the Difference of Two Proportions
Isabella Lopez
9 min read
Listen to this study note
Study Guide Overview
This guide covers two-sample z-intervals for comparing proportions between two independent populations. It explains the purpose, use case, and steps to construct the interval, including calculating sample proportions, standard error, and finding the critical value. The guide emphasizes checking conditions (randomness, independence, and normality) before calculations and provides the formula and a calculator shortcut. It includes an example comparing shooting percentages and focuses on exam preparation by highlighting key concepts, common mistakes, and interpretation of results. Finally, it offers practice multiple-choice and free-response questions with a scoring guide.
#AP Statistics: Two-Sample Z-Intervals - Your Ultimate Guide 🚀
Hey there, future AP Stats master! Let's dive into two-sample z-intervals, a crucial tool for comparing proportions between two groups. Think of it as your secret weapon for those tricky comparison questions. By the end of this guide, you'll be ready to tackle any problem with confidence! 💪
#
Introduction: Comparing Two Proportions
Ever wondered if one group is really different from another? Like, is one basketball player's three-point percentage significantly better than another's? 🏀 That's where two-sample z-intervals come in! They help us estimate the true difference in proportions between two independent populations. Let's break it down:
#What is a Two-Sample Z-Interval?
It's a confidence interval used to compare the proportions of a categorical variable between two independent populations. Essentially, we're trying to find a range of plausible values for the difference between two population proportions.
- Purpose: To estimate the difference between two population proportions.
- Use Case: Comparing proportions of a categorical variable between two independent groups.
- Key Idea: If the interval contains 0, there might not be a significant difference between the proportions.
#Steps to Construct a Two-Sample Z-Interval
-
Calculate Sample Proportions: Find p̂1 (sample proportion for group 1) and p̂2 (sample proportion for group 2).
-
Calculate Standard Error (SE): Use the formula: SE = √(p̂1(1-p̂1)/n1 + p̂2(1-p̂2)/n2) (See image below for a clearer view).
-
Find the Critical Value (z):* Determine the z-score corresponding to your desired confidence level (e.g., 1.96 for 95% confidence).
-
Calculate the Interval: Use the formula: (p̂1 - p̂2) ± z* * SE
"P-hats, SE, and Z, that's the way!" Remember this little rhyme to recall the key components for constructing a two-sample z-interval. P-hats (sample proportions), Standard Error, and the Z-score.
#
Checking the Necessary Conditions
Before we jump into calculations, we need to make sure our data meets certain conditions. These are crucial for valid inferences!
#1. Randomness
- Random Sampling: Both samples must come from random samples. If not, we can't generalize our findings to the population. 😞
#2. Independence
- 10% Condition: Each population should be at least 10 times larger than its respective sample size.
- Random Assignment: If it's a randomized experiment, the random assignment of treatments ensures independence. 🔟
#3. Normality
- Large Counts Condition: Check that both samples have at least 10 expected successes and 10 expected failures. In other words, n₁p̂₁ ≥ 10, n₁(1-p̂₁) ≥ 10, n₂p̂₂ ≥ 10, and n₂(1-p̂₂) ≥ 10. 🔔

Always state the conditions and verify them before proceeding with calculations. Don't just assume they are met! This is a key part of the rubric.
#
The Nitty-Gritty: Calculation Details
Let's get into the calculation details. Remember, a confidence interval has two key parts: a point estimate and a margin of error. 😲
#1. Point Estimate
-
For two-sample proportions, the point estimate is the difference between the two sample proportions: p̂1 - p̂2. ### 2. Margin of Error
-
The margin of error is the "buffer zone" around our point estimate. It's calculated using the critical value (z-score) and the standard error.
#The Formula
- The complete formula for a two-sample z-interval is:
(p̂1 - p̂2) ± z* * √(p̂1(1-p̂1)/n1 + p̂2(1-p̂2)/n2)
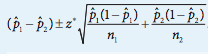
Image courtesy of apcentral.collegeboard.org
#Calculator Shortcut
-
Use the "2-PropZInt" function on your calculator. It's a much faster way to get the interval! 😌
Don't mix up the order of subtraction! (p̂1 - p̂2) is not the same as (p̂2 - p̂1). The context of the problem will tell you which group to subtract from which.
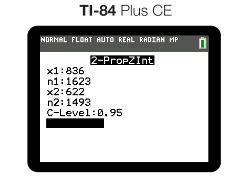
#Example: MJ vs. Lebron 🏀
Let's settle the age-old debate: Is Michael Jordan's shooting percentage really different from Lebron James's? We'll use a 95% confidence interval to find out! ☄️
#Data
- MJ: 1623 attempts, 836 made
- Lebron: 1493 attempts, 622 made
#Conditions
- Random: We'll assume the shots from their first season are representative.
- Independent: It's reasonable to believe they each took at least 10 times the number of shots in their careers.
- Normal: Both had at least 10 makes and misses in their samples.
#Calculations
- Using the "2-PropZInt" function on the calculator:
- The resulting interval is:
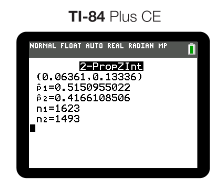
#Interpretation
-
We are 95% confident that the true difference in the proportion of shots made between Michael Jordan and Lebron James is between 0.075 and 0.146. Since the interval does not contain zero, there is a statistically significant difference between the two players' shooting proportions.
Remember, if the confidence interval contains zero, it suggests that there might not be a significant difference between the two population proportions.
#Final Exam Focus
Okay, you're almost there! Here's what to focus on for the exam:
-
Conditions, Conditions, Conditions: Always check and verify the random, independent, and normal conditions. This is a major part of the rubric.
-
Calculator Skills: Be comfortable using the "2-PropZInt" function on your calculator. It will save you time.
-
Interpretation: Practice interpreting the meaning of the confidence interval in the context of the problem.
-
Connecting Concepts: Two-sample z-intervals often appear in questions that also test your understanding of sampling distributions and hypothesis testing.
-
Common Pitfalls: Double-check your calculations, especially the standard error and the order of subtraction for the point estimate. Be mindful of the difference between population and sample values.
When interpreting the interval, use the phrase "We are [confidence level]% confident that the true difference in [context] is between [lower bound] and [upper bound]."
#Practice Questions
Let's put your knowledge to the test! Here are some practice questions to get you ready:
Practice Question
#Multiple Choice Questions
-
A researcher wants to compare the proportion of adults who support a new policy in two different cities. They take a random sample of 200 adults from City A and find that 120 support the policy. They also take a random sample of 250 adults from City B and find that 140 support the policy. Which of the following is the correct standard error for the difference in sample proportions?
(A) √((0.6)(0.4)/200 + (0.56)(0.44)/250) (B) √((0.6)(0.4)/200 - (0.56)(0.44)/250) (C) √((0.6+0.56)/2 * (0.4+0.44)/2 * (1/200 + 1/250)) (D) √((0.6)(0.4) + (0.56)(0.44) / (200+250)) (E) √((0.6)(0.4)/200) + √((0.56)(0.44)/250)
-
A 90% confidence interval for the difference in proportions of two groups is found to be (-0.05, 0.15). Which of the following is a correct interpretation?
(A) There is a 90% chance that the true difference in proportions falls between -0.05 and 0.15. (B) We are 90% confident that the true difference in proportions falls between -0.05 and 0.15. (C) We are 90% confident that the sample difference in proportions falls between -0.05 and 0.15. (D) There is a 90% chance that the sample difference in proportions falls between -0.05 and 0.15. (E) There is a 90% chance that the true difference in proportions is 0. 3. A study compares the effectiveness of two different medications for treating a specific condition. In a random sample of 100 patients taking medication A, 60 experience improvement. In a random sample of 120 patients taking medication B, 70 experience improvement. What is the point estimate for the difference in the proportions of patients who experience improvement?
(A) 0.017 (B) 0.025 (C) 0.083 (D) 0.100 (E) 0.183
#Free Response Question
A researcher is studying the effectiveness of two different teaching methods for math. They randomly assign 150 students to Method A and 180 students to Method B. After a semester, they find that 105 students in Method A and 126 students in Method B passed the final exam. Construct and interpret a 95% confidence interval for the difference in the proportions of students who passed the exam using the two methods.
#Scoring Guide:
Part 1: Conditions (3 points)
-
1 point for stating the random condition and verifying that the samples were randomly assigned.
-
1 point for stating the independence condition and verifying that the populations of students are at least 10 times the sample sizes.
-
1 point for stating the normal condition and verifying that all of the expected successes and failures are at least 10. Part 2: Calculations (2 points)
-
1 point for calculating the correct sample proportions and standard error.
-
1 point for calculating the correct confidence interval using the correct critical value.
Part 3: Interpretation (1 point)
- 1 point for providing a correct interpretation of the interval in context.
#Answers
Multiple Choice:
- (A) √((0.6)(0.4)/200 + (0.56)(0.44)/250)
- (B) We are 90% confident that the true difference in proportions falls between -0.05 and 0.15. 3. (C) 0.083
Free Response:
Part 1: Conditions
-
Random: The problem states that students were randomly assigned to the two teaching methods.
-
Independent: It is reasonable to assume that there are at least 1500 students using method A and 1800 students using method B.
-
Normal: n₁p̂₁ = 105, n₁(1-p̂₁) = 45, n₂p̂₂ = 126, and n₂(1-p̂₂) = 54. All are greater than 10. Part 2: Calculations
-
p̂₁ = 105/150 = 0.7, p̂₂ = 126/180 = 0.7
-
SE = √((0.7)(0.3)/150 + (0.7)(0.3)/180) ≈ 0.048
-
95% CI: (0.7 - 0.7) ± 1.96 * 0.048 = (-0.094, 0.094)
Part 3: Interpretation
- We are 95% confident that the true difference in the proportion of students who passed the final exam using method A and method B is between -0.094 and 0.094.
You've got this! Keep practicing, and you'll be an AP Stats pro in no time. Good luck! 🌟
Continue your learning journey


How are we doing?
Give us your feedback and let us know how we can improve