Production Possibilities Curve (PPC)
Daniel Gray
10 min read
Listen to this study note
Study Guide Overview
This AP Microeconomics study guide covers the Production Possibilities Curve (PPC), including foundational concepts of scarcity, opportunity cost, and trade-offs. It explains production possibilities, efficiency, and how the PPC visually represents these concepts. The guide details how to interpret the PPC graph, focusing on increasing and constant opportunity costs. It also covers economic growth and factors that shift the PPC, such as changes in resources, technology, and trade. Finally, it provides practice questions and exam tips.
#AP Microeconomics: Production Possibilities Curve (PPC) - Your Ultimate Guide 🚀
Hey there, future AP Micro superstar! Let's get you prepped and confident for your exam. This guide is designed to be your go-to resource, especially the night before the big day. We'll break down the Production Possibilities Curve (PPC) and related concepts in a way that's easy to understand and remember. Let's dive in!
#🤔 Foundational Concepts: Scarcity, Opportunity Cost, and Trade-offs
Before we jump into the PPC, let's do a quick recap of the core ideas that underpin everything in economics:
- Scarcity: 🌍 Limited resources + unlimited wants = the fundamental economic problem. We can't have everything we want, so we must make choices.
- Trade-offs: ⚖️ Because of scarcity, every decision involves giving something up. It's about choosing one thing over another.
- Opportunity Cost: 💸 The value of the next best alternative you give up when making a choice. It's not just about money; it's about the value of what you could have done instead.
Understanding these three concepts is crucial because they are the foundation for all economic decision-making. They are also frequently tested on the AP exam!
#🏭 What Are "Production Possibilities"?
Production possibilities are all the different combinations of goods and services an economy can produce with its limited resources and technology. Think of it as what's possible given what we have.
#ud83dudcc8 Introduction to the Production Possibilities Curve (PPC)
Imagine a simple economy that only makes two things: guns and butter. This classic example represents capital goods (guns) and consumer goods (butter).
- Every time we make more butter, we use up resources, meaning we have fewer resources to make guns. And vice versa.
- Each combination of guns and butter that uses all of our resources is an efficient output.
- If we don't use all our resources, we're underutilizing them. We could make more of one or both goods without sacrificing the other.
- Trying to produce beyond our resource limits is impossible or unattainable.
#📈 Introduction to the Production Possibilities Curve (PPC)
The Production Possibilities Curve (PPC), also sometimes called the Production Possibilities Frontier (PPF), is a graph that visualizes these production possibilities for two goods. Here are the key assumptions:
- Only two goods can be produced.
- The quantity of resources is fixed.
- Technology is fixed.
Remember "Two Fixed Things" for the PPC assumptions: Two goods, fixed resources, and fixed technology.
Here's what a typical PPC looks like:

Source: Wikipedia
- The blue line represents all efficient combinations of guns and butter. These points are the maximum output given our resources.
- Points on the PPC demonstrate productive efficiency.
- Point A represents underutilization of resources (we could produce more).
- Point X represents an unattainable level of production (we don't have enough resources).
#⚙️ Efficiency and the PPC
Let's clarify the types of efficiency:
- Allocative Efficiency: 🎯 Producing the specific mix of goods that society desires. This is the point on the PPC that best meets society's needs. For example, if a society needs equal amount of sugar and wheat, the allocatively efficient point would be C on the graph below.
- Productive Efficiency: ⚙️ Producing at the lowest possible cost. This is represented by any point on the PPC. All points on the curve are productively efficient.

- Points A, B, C, D, and E are productively efficient.
- Point F is inefficient (underutilization).
- Point G is unattainable.
#🧈 Opportunity Costs and the PPC
The PPC is a great tool to visualize opportunity cost. Remember, it's what you give up when you make a choice. On the PPC, opportunity cost is represented by moving along the curve.
- To make more butter, you must give up some guns (move down and right on the curve).
- The change in guns represents the opportunity cost of producing more butter.
#Increasing and Constant Opportunity Cost
- Increasing Opportunity Cost: 📈 As you produce more of one good, the opportunity cost (what you give up) increases. This is why the PPC is often bowed-out. The slope of the PPC gets steeper as you move along the curve. This happens because resources aren't perfectly adaptable to producing different goods.
- Constant Opportunity Cost: 📏 You give up the same amount of one good for each additional unit of the other good. This is shown by a straight-line PPC. The slope of the PPC is constant.
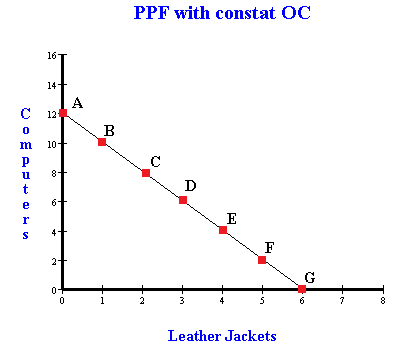
Bowed-Out PPC = Increasing Opportunity Cost. Think of it like a bowl; the slope gets steeper as you go up the sides.
#💰 Economic Growth
Economic growth is shown by a shift of the entire PPC to the right. ➡️ This means we can produce more of both goods.

- Previously unattainable points become attainable.
Economic contraction is shown by a shift of the entire PPC to the left. ⬅️ This means we can produce less of both goods.

#⚙️ Shifters of the Production Possibilities Curve (PPC)
Here are the factors that can shift the PPC:
- Change in the quantity or quality of resources: More or better resources shift the PPC outward. Less or lower quality resources shift it inward.
- Change in technology: Improvements in technology shift the PPC outward. This is especially true if the technology impacts both goods.
- Trade: Specialization and trade can allow a country to consume beyond its own PPC.
Remember "Resources, Tech, and Trade" as the shifters of the PPC. These are often tested on the AP exam.
Here are some visual examples of these shifts:

- Left graph: Improvement in the quality of resources (human capital) leads to economic growth.
- Right graph: A country is producing at an inefficient point due to high unemployment.

- Left graph: A technology change impacts only one good.
- Right graph: A decrease in the quantity of resources (e.g., fewer workers) shifts the PPC inward.
#🎯 Final Exam Focus
The PPC is a foundational concept that appears in many forms on the AP exam. Make sure you understand:
- How to draw and interpret a PPC.
- The difference between productive and allocative efficiency.
- How to calculate opportunity cost from the PPC.
- What causes the PPC to shift.
#Common Question Types:
- Multiple Choice: Expect questions about identifying efficient vs. inefficient points, calculating opportunity cost, and understanding the shifters of the PPC.
- Free Response: FRQs often involve drawing a PPC, showing the effects of economic growth or contraction, and explaining the trade-offs involved in different production choices.
#Last-Minute Tips:
- Time Management: Don't spend too long on any one question. If you're stuck, move on and come back later.
- Common Pitfalls: Be careful not to confuse productive and allocative efficiency. Also, make sure you understand the difference between a movement along the PPC and a shift of the PPC.
- Strategies: Practice drawing PPCs and calculating opportunity costs. Review the shifters of the PPC and make sure you can explain them clearly.
When drawing a PPC, always label your axes and clearly indicate the different points and shifts.
#Practice Questions
Practice Question
#Multiple Choice Questions
-
Which of the following best describes the concept of opportunity cost? (A) The monetary price of a good or service. (B) The cost of all inputs used in production. (C) The value of the next best alternative that is forgone when a choice is made. (D) The total cost of producing a good or service. (E) The value of all resources used in production.
-
A point inside the production possibilities curve indicates: (A) Full employment of resources. (B) Efficient use of resources. (C) An unattainable production level. (D) Unemployment or underemployment of resources. (E) Economic growth.
-
A technological improvement in the production of one good will cause the production possibilities curve to: (A) Shift inward, parallel to the original curve. (B) Shift outward, parallel to the original curve. (C) Shift outward, pivoting along the axis of the good with the technological improvement. (D) Shift inward, pivoting along the axis of the good with the technological improvement. (E) Remain unchanged.
#Free Response Question
Assume that a country can produce two goods: wheat and computers. The country's production possibilities are shown in the table below:
| Combination | Wheat (tons) | Computers |
|---|---|---|
| A | 0 | 1000 |
| B | 200 | 800 |
| C | 350 | 600 |
| D | 450 | 400 |
| E | 500 | 0 |
(a) Draw a correctly labeled production possibilities curve (PPC) showing the combinations of wheat and computers.
(b) Calculate the opportunity cost of increasing wheat production from 200 to 350 tons.
(c) Assume there is a technological improvement in the production of computers. Show on your graph from part (a) how this would affect the PPC. Label the new curve PPC2. (d) Assume that the country is producing at point C. Is this productively efficient? Is this allocatively efficient? Explain.
#Scoring Guidelines for FRQ
(a) Drawing the PPC (3 points)
- 1 point for correctly labeling the axes (Wheat on x-axis, Computers on y-axis).
- 1 point for plotting the points correctly.
- 1 point for drawing a bowed-out curve connecting the points.
(b) Opportunity Cost (2 points)
- 1 point for identifying the change in wheat production (350-200 = 150 tons).
- 1 point for calculating the opportunity cost in terms of computers (800-600 = 200 computers, so 200 computers/150 wheat = 1.33 computers per ton of wheat).
(c) Technological Improvement (2 points)
- 1 point for showing the PPC shifting outward.
- 1 point for showing that the shift is greater along the computer axis than the wheat axis.
(d) Efficiency (2 points)
- 1 point for stating that point C is productively efficient because it is on the PPC.
- 1 point for stating that it cannot be determined if point C is allocatively efficient without more information about society's preferences.
You've got this! Remember, the key is to understand the concepts, not just memorize them. Good luck, and go ace that exam! 🌟
Continue your learning journey


How are we doing?
Give us your feedback and let us know how we can improve