Changes in Factor Demand and Factor Supply
Nancy Hill
11 min read
Listen to this study note
Study Guide Overview
This study guide covers factor markets, focusing on labor. It explains factor supply and demand, including the laws of supply and demand in these markets. It details market equilibrium, labor shortages and surpluses, and the impact of government interventions like minimum wage. The guide also covers determinants of factor demand and supply, such as changes in productivity, product demand, immigration, and regulations. Finally, it provides practice questions, exam tips, and common mistakes to avoid.
#AP Microeconomics: Factor Markets - The Ultimate Study Guide 🚀
Hey there, future AP Micro master! Let's dive into factor markets, where things get a little flipped but still follow the same awesome logic. This guide is designed to make sure you're not just ready, but excited for the exam! Let's get started.
#
Factor Supply and Demand: The Basics
In factor markets, we're talking about the market for inputs (like labor) rather than outputs (like goods and services). Think of it as the flip side of the coin from what we've seen before. Instead of consumers demanding goods, firms demand labor. Let's break it down:
#Factor Supply (Labor Supply)
-
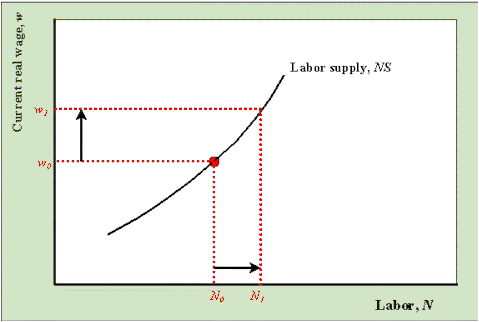
What it is: Factor supply, often called labor supply, is the amount of labor workers are willing and able to offer at different wage rates. It's all about the workers' perspective! 🧑💼
-
The Law of Supply: Just like regular supply, labor supply is upward-sloping. Higher wages = more people willing to work. Makes sense, right? More money for your time = more time you're willing to give!
Think of it this way: If your job suddenly paid double, you'd probably be willing to work more hours, right? That's the essence of the labor supply curve.
-
Economist Note: You might see labor represented as "N" (or "L") in graphs. Don't let it throw you off! It's just a different way of saying "labor." 🤓

#Factor Demand (Labor Demand)
-
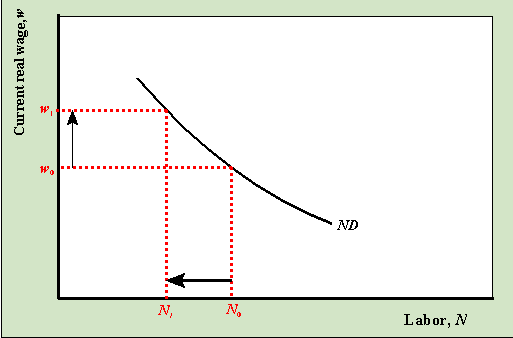
What it is: Factor demand, or labor demand, is the amount of labor firms are willing and able to hire at different wage rates. This is the firms' perspective! 🏢
-
The Law of Demand: Like regular demand, labor demand is downward-sloping. Higher wages = firms hiring less labor. Lower wages = firms hiring more labor. Firms are always looking to maximize profits, so they'll hire more when labor is cheaper.

#Factor Market Equilibrium
-
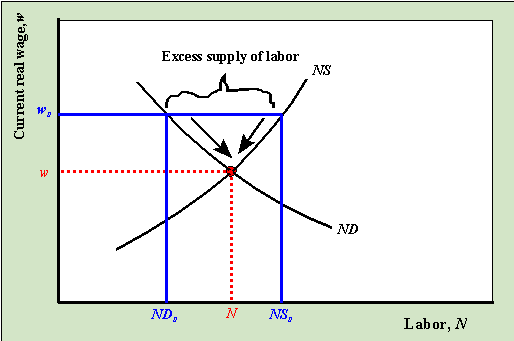
Equilibrium: The magic spot where labor supply meets labor demand. This point determines the market wage rate and the quantity of labor employed. It's where everyone who wants a job at the market wage gets one, and all firms that want to hire at that wage can find workers. 🤝

#Shortages and Surpluses of Labor
-
Surplus of Labor: When the wage is too high, more people want to work than firms want to hire. This could be due to a wage floor, like a minimum wage. Result: Unemployment. 😟

-
Shortage of Labor: When the wage is too low, firms want to hire more people than are willing to work. This could be due to a wage ceiling. Result: Unfilled positions. 😕

Practice Question
Multiple Choice Questions
-
Which of the following would cause an increase in the demand for labor? (A) A decrease in the price of the product the labor produces. (B) An increase in the productivity of labor. (C) A decrease in the wage rate. (D) An increase in the supply of labor. (E) A decrease in the demand for the product the labor produces.
-
A minimum wage set above the equilibrium wage in a labor market will most likely result in: (A) A shortage of labor. (B) An increase in the demand for labor. (C) A surplus of labor. (D) No change in the quantity of labor employed. (E) An increase in the supply of labor.
Free Response Question
Assume the market for fast food workers is perfectly competitive. The current equilibrium wage is
(a) Draw a correctly labeled graph of the labor market, showing the equilibrium wage and quantity.
(b) Suppose the government imposes a minimum wage of12 per hour. On your graph, show the effect of this minimum wage on the labor market.
(c) Explain the effect of the minimum wage on both the quantity of labor supplied and the quantity of labor demanded.
(d) Explain the effect of the minimum wage on the level of unemployment.
Answer Key
Multiple Choice Questions
- (B)
- (C)
Free Response Question
(a) * Correctly labeled axes (Wage on the vertical, Quantity of Labor on the horizontal) * Downward sloping labor demand curve * Upward sloping labor supply curve * Equilibrium point labeled at
(b) * Horizontal line drawn at12, above the equilibrium wage * Label the quantity demanded (Qd) and quantity supplied (Qs) at the new wage
(c) * Quantity of labor supplied increases * Quantity of labor demanded decreases
(d) * The minimum wage creates a surplus of labor, leading to unemployment
#
Determinants of Factor Demand
What makes firms want to hire more or less labor? Here are the key factors that shift the labor demand curve:
#Prices of Related Inputs
- Substitute Resources: If the price of one input (like copper) goes up, firms will demand more of a substitute (like plastic). They'll switch to the cheaper option. 🔄
- Complementary Resources: If the price of one input (like aluminum) goes up, firms will demand less of its complement (like sugar). They're used together, so if one gets expensive, they'll use less of both. 🤝
#Changes in Productivity
- Increased Productivity: If workers become more efficient (maybe through new tech), they produce more, increasing their value to the firm. This leads to an increase in labor demand. 💡
#Product Demand
-
Increased Product Demand: If people want more of a product (like pizza), firms will need more resources to make it, including more labor. This increases labor demand. 🍕
-
Product Price Changes: If the price of a product decreases, the value of the labor that produces it decreases, lowering labor demand. (Remember, MRP = MP x Price). 📉


Practice Question
Multiple Choice Questions
-
If the price of a substitute resource decreases, what will happen to the demand for the original resource? (A) Increase (B) Decrease (C) No change (D) Increase then decrease (E) Decrease then increase
-
A new technology increases the productivity of workers. What is the most likely effect on the labor market? (A) Decrease in labor demand (B) Increase in labor supply (C) Increase in labor demand (D) Decrease in labor supply (E) No change in labor demand or supply
Free Response Question
Suppose the market for construction workers is initially in equilibrium. A new, cheaper material is introduced that can be used as a substitute for concrete. At the same time, there is an increase in demand for new housing.
(a) Explain how the introduction of the new material will affect the demand for construction workers.
(b) Explain how the increase in demand for new housing will affect the demand for construction workers.
(c) Using a correctly labeled graph, show the combined effect of these two changes on the labor market for construction workers.
Answer Key
Multiple Choice Questions
- (B)
- (C)
Free Response Question
(a) * The new material is a substitute for concrete, which means less demand for construction workers specialized in concrete work, decreasing labor demand
(b) * The increased demand for new housing will increase the demand for construction workers, increasing labor demand
(c) * Correctly labeled axes (Wage on the vertical, Quantity of Labor on the horizontal) * Downward sloping labor demand curve labeled D1 * Upward sloping labor supply curve labeled S1 * Initial equilibrium point labeled E1 * A new labor demand curve D2 shifted to the left of D1 * A new labor demand curve D3 shifted to the right of D1 * New equilibrium point E2, with wage and quantity changes depending on magnitude of the shifts
#
Determinants of Factor Supply
What makes more or fewer people want to work? Let's look at the factors that shift the labor supply curve:
#Number of Qualified Workers
- Immigration: More immigration = more workers, shifting the labor supply curve to the right. Stricter laws = fewer workers, shifting it left. 🛂
- Education and Training: More people with specific skills = more workers in that field, shifting the labor supply curve to the right. 🎓
#Government Regulations
- Licensing and Certification: If it becomes harder to get a license, fewer people will enter that field, shifting the labor supply curve to the left. 📜
#Personal Values
-
Leisure Time: If people value leisure more, they'll work less, shifting the labor supply curve to the left. 🏖️
-
Societal Roles: Changes in social norms can affect labor supply. For example, more women entering the workforce shifts the supply curve to the right. 👩🏭
-
Wealth Effect: If people get wealthier, they may choose to work less, shifting the labor supply curve to the left. 💰

#Changes in the Labor Market Equilibrium
-
Combined Shifts: Remember, both labor demand and supply can change at the same time. This leads to new equilibrium points. 📈


Remember: Shifts in demand and supply curves lead to changes in equilibrium wage and quantity. Always analyze how each determinant affects the curves.
Practice Question
Multiple Choice Questions
-
Which of the following would cause a decrease in the supply of labor? (A) An increase in immigration. (B) A decrease in the number of people with relevant skills. (C) A decrease in the wage rate. (D) An increase in the demand for the product the labor produces. (E) A decrease in the wealth of the population.
-
A government regulation makes it more difficult to obtain a professional license. What is the most likely effect on the labor market? (A) Increase in labor demand (B) Decrease in labor supply (C) Increase in labor supply (D) Decrease in labor demand (E) No change in labor demand or supply
Free Response Question
The market for nurses is initially in equilibrium. Suppose there is a significant increase in the number of nursing school graduates, and at the same time, there is an increase in the demand for healthcare services due to an aging population.
(a) Explain how the increase in nursing school graduates will affect the supply of nurses.
(b) Explain how the increase in demand for healthcare services will affect the demand for nurses.
(c) Using a correctly labeled graph, show the combined effect of these two changes on the labor market for nurses.
Answer Key
Multiple Choice Questions
- (B)
- (B)
Free Response Question
(a) * The increase in nursing school graduates will increase the supply of nurses, shifting the labor supply curve to the right.
(b) * The increased demand for healthcare services will increase the demand for nurses, shifting the labor demand curve to the right.
(c) * Correctly labeled axes (Wage on the vertical, Quantity of Labor on the horizontal) * Downward sloping labor demand curve labeled D1 * Upward sloping labor supply curve labeled S1 * Initial equilibrium point labeled E1 * A new labor supply curve S2 shifted to the right of S1 * A new labor demand curve D2 shifted to the right of D1 * New equilibrium point E2, with wage and quantity changes depending on magnitude of the shifts
#Final Exam Focus 🎯
Okay, you've made it to the final stretch! Here's what to focus on for the exam:
High Priority Topics:
*   **Factor Market Basics:** Understand how supply and demand work in factor markets, and how they differ from product markets.
*   **Determinants of Demand and Supply:** Know what shifts the labor demand and supply curves. Practice drawing graphs to visualize these shifts.
*   **Market Equilibrium:** Be able to identify equilibrium, as well as shortages and surpluses. Understand how government interventions (like minimum wage) affect the market.
*
Common Question Types:
*   **Graphing:** Be prepared to draw and interpret graphs showing shifts in labor demand and supply. Practice labeling axes and curves correctly.
*   **Scenario Analysis:** Expect questions that ask you to analyze how specific events (like new technology or government regulations) affect the labor market.
*   **Multiple Choice:** Focus on understanding the concepts, not just memorizing facts. Apply your knowledge to different scenarios.
*   **Free Response:** Clearly explain your reasoning, and use graphs to support your answers. Remember to label everything!
*
Last Minute Tips:
*   **Time Management:** Don't spend too long on one question. If you're stuck, move on and come back later.
*   **Read Carefully:** Pay close attention to the wording of each question. Make sure you understand what's being asked.
*   **Stay Calm:** Take a deep breath and trust in your preparation. You've got this! 💪
Common Mistakes to Avoid:
- Confusing shifts in demand/supply with movements along the curves.
- Forgetting to label axes and curves on graphs.
- Not explaining the reasoning behind your answers in free-response questions.
- Misunderstanding the direction of a shift.
Good luck, you're going to ace this exam! 🎉
Continue your learning journey

How are we doing?
Give us your feedback and let us know how we can improve


