Inequality
Nancy Hill
7 min read
Listen to this study note
Study Guide Overview
This study guide covers income inequality, focusing on income vs. wealth inequality, the Lorenz Curve and Gini Coefficient, and the impact of progressive, regressive, and proportional taxes. It explains how to interpret and calculate these measures, and their relationship to market failure. Practice questions and exam tips are included.
#AP Microeconomics: Income Inequality - The Final Frontier!
YOU MADE IT!!! 🎉 You've conquered supply and demand, monopolies, game theory, and more! Now, let's tackle the final piece: income inequality. This unit is crucial for understanding how markets can fail and how we measure and address inequality. Let's dive in!
#Types of Inequality
There are two main types of economic inequality:
-
Income Inequality: How annual earnings are distributed.
-
Wealth Inequality: How assets are distributed.
Sources of inequality include: - Abilities/Human Capital - Social Capital - Inheritance - Effects of Discrimination - Access to Financial Markets - Mobility - Bargaining Power
#The Lorenz Curve
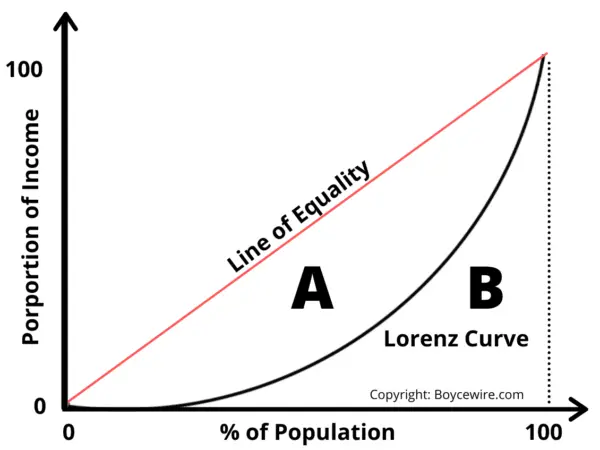
The Lorenz Curve is a visual tool to represent income inequality. It plots the cumulative percentage of income against the cumulative percentage of the population. The further the curve is from the line of perfect equality, the greater the inequality. 💡

Gini Coefficient: A numerical measure of income inequality, ranging from 0 (perfect equality) to 1 (perfect inequality). It's calculated as the ratio of the area between the line of perfect equality and the Lorenz curve (Area A) to the total area under the line of perfect equality (Area A + B).
A higher Gini coefficient means greater income inequality. The world average Gini Coefficient is between 0.61 and 0.68.

Think of the Lorenz curve like a bow. The more the bowstring (Lorenz curve) sags away from the straight line (perfect equality), the greater the inequality. The Gini coefficient is like measuring how much the bow is bent.
#Types of Taxes
Taxes can either worsen or mitigate income inequality. Let's break down the main types:
- Progressive Taxes: Take a larger percentage of income from high-income groups. ⬆️
- Example: Federal Income Tax in the U.S. (higher income = higher tax rate).
- Example: Federal Income Tax in the U.S. (higher income = higher tax rate).
- Regressive Taxes: Take a larger percentage from low-income groups. ⬇️
- Example: Sales tax. Even though everyone pays the same rate, it's a larger burden for those with lower incomes.
A flat tax is actually regressive because lower-income groups pay a higher percentage of their income.
- **Proportional Taxes**: Take the same percentage of income from all income groups. ⚖️ - Example: A flat income tax where everyone pays the same percentage.
Transfer payments (like welfare) are government payments to individuals or businesses designed to meet a specific objective rather than pay for goods or resources. They can help reduce income inequality.
Understanding the Lorenz curve, Gini coefficient, and the different types of taxes is crucial for the exam. Be ready to analyze how these concepts relate to income inequality.
#Final Exam Focus
-
Lorenz Curve & Gini Coefficient: Be able to draw a Lorenz curve, explain what it represents, and calculate the Gini coefficient. Understand how changes in income distribution affect the curve and the Gini coefficient.
-
Tax Systems: Know the difference between progressive, regressive, and proportional taxes. Understand how each affects income distribution and equity.
-
Market Failure: Understand that income inequality is a form of market failure and how the government can intervene to address it.
- When answering FRQs, clearly label all axes and curves.
- Be precise in your definitions of key terms (e.g., Gini coefficient, progressive tax).
- Practice drawing and interpreting Lorenz curves.
- Connect income inequality concepts to other units, such as externalities and public goods.
Practice Question
#Practice Questions
Multiple Choice Questions
-
Which of the following best describes a regressive tax? (A) A tax that takes a larger percentage of income from high-income earners. (B) A tax that takes a larger percentage of income from low-income earners. (C) A tax that takes the same percentage of income from all income earners. (D) A tax that is only applied to luxury goods. (E) A tax that is not applied to essential goods.
-
A country's Lorenz curve shifts further away from the line of perfect equality. This indicates: (A) A decrease in income inequality. (B) An increase in income equality. (C) An increase in income inequality. (D) No change in income inequality. (E) A decrease in the Gini coefficient.
-
Which of the following is NOT a source of economic inequality? (A) Differences in human capital (B) Inheritance (C) Government transfer payments (D) Discrimination (E) Access to financial markets
Free Response Question
Assume a hypothetical economy with the following income distribution:
| Income Group | Percentage of Population | Percentage of Total Income |
|---|---|---|
| Lowest 20% | 20% | 5% |
| Second 20% | 20% | 10% |
| Middle 20% | 20% | 15% |
| Fourth 20% | 20% | 25% |
| Highest 20% | 20% | 45% |
(a) Draw a fully labeled Lorenz curve for this economy. Be sure to label the axes and the line of perfect equality. (b) Calculate the Gini coefficient for this economy. Show your work. (c) Suppose the government implements a progressive tax system. Explain how this would affect the Lorenz curve and Gini coefficient.
Answer Key
Multiple Choice
- (B)
- (C)
- (C)
Free Response Question
(a) Lorenz Curve
- X-axis: Cumulative percentage of the population (2 points)
- Y-axis: Cumulative percentage of income (2 points)
- Line of perfect equality: Straight diagonal line (1 point)
- Lorenz curve: Plotted correctly based on the given data (2 points)
(b) Gini Coefficient
- Area A: Calculate the area between the perfect equality line and the Lorenz curve. This can be done by finding the area under the perfect equality line (0.5) and subtracting the area under the Lorenz curve. (2 points)
- Area B: Calculate the area under the Lorenz curve (0.25)
- Gini Coefficient: A / (A + B) = 0.25 / 0.5 = 0.5 (2 points)
(c) Progressive Tax Impact
- Lorenz Curve: The Lorenz curve would shift closer to the line of perfect equality (1 point)
- Gini Coefficient: The Gini coefficient would decrease (1 point)
- Explanation: A progressive tax system takes a larger percentage of income from higher earners and redistributes it to lower earners, resulting in a more equal income distribution (2 points)
You've got this! Remember to stay calm, focus on the key concepts, and trust your preparation. Good luck on the exam! 💪
Continue your learning journey


How are we doing?
Give us your feedback and let us know how we can improve