Sine and Cosine Function Graphs
Olivia King
7 min read
Listen to this study note
Study Guide Overview
This study guide covers the unit circle, focusing on sine (y-coordinate) and cosine (x-coordinate) values and their relationship to angles. It explains how to construct and interpret sine and cosine graphs, including key points, oscillation, and periodicity. The guide also includes a review of key concepts for an exam, common question types, and practice problems with solutions.
#Mastering Sine and Cosine Graphs: Your Ultimate Guide
Hey there, future AP Pre-Calculus master! Let's dive into the world of sine and cosine graphs. Think of this as your backstage pass to understanding how these functions work, straight from the unit circle to the coordinate plane. Let's get started!
#
The Unit Circle: Your Foundation
Before we graph, let's revisit the star of the show: the unit circle. It's a circle with a radius of 1, centered at the origin. It's where all the magic of sine and cosine begins.
Image courtesy of Remind.
#
Cosines: The X-Factor
- The cosine of an angle is the x-coordinate of a point on the unit circle.
- As you move counterclockwise:
- From 0 to π radians, cosine values decrease (1 to -1).
- From π to 2π radians, cosine values increase (-1 to 1).
- Cosine values range from -1 to 1.
- Maximum (1) at 0 radians (1,0).
- Minimum (-1) at π radians (-1,0).
- Zero at π/2 and 3π/2 radians.
#Sines: The Y-Factor
- The sine of an angle is the y-coordinate of a point on the unit circle.
- As you move counterclockwise:
- From 0 to π/2 radians, sine values increase (0 to 1).
- From π/2 to 3π/2 radians, sine values decrease (1 to -1).
- From 3π/2 to 2π radians, sine values increase (-1 to 0).
- Sine values range from -1 to 1.
- Maximum (1) at π/2 radians (0,1).
- Minimum (-1) at 3π/2 radians (0,-1).
- Zero at 0 and π radians.
Mnemonic: "Cos is like an 'x' (horizontal), and Sin is like a 'y' (vertical)." This helps remember which coordinate each function represents on the unit circle.
#
Constructing Sine Curves
#What is Sine?
- Sine is a trigonometric function that relates an angle to the ratio of the opposite side to the hypotenuse in a right triangle. On the unit circle, it's the y-coordinate.
#From Circle to Curve
- Plotting Points: We use the sine values from the unit circle for different angles.
- Oscillation: The graph oscillates between -1 and 1. 3. Key Points:
- (0, 0): Starts at the origin.
- (π/2, 1): Maximum value.
- (π, 0): X-intercept.
- (3π/2, -1): Minimum value.
- (2π, 0): Back to the start.

Image courtesy of Wikimedia.
#The Sine Function
- Function Notation: f(θ) = sin(θ)
- Periodicity: Repeats every 2π radians.
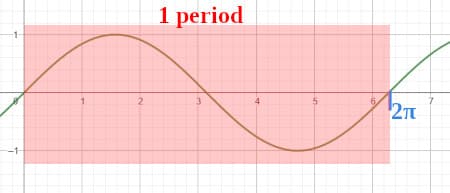
Image courtesy of Study.
#
Constructing Cosine Curves
#What is Cosine?
- Cosine is a trigonometric function that relates an angle to the ratio of the adjacent side to the hypotenuse in a right triangle. On the unit circle, it's the x-coordinate.
#From Circle to Curve
- Plotting Points: We use the cosine values from the unit circle for different angles.
- Oscillation: The graph oscillates between -1 and 1. 3. Key Points:
- (0, 1): Starts at its maximum.
- (π/2, 0): X-intercept.
- (π, -1): Minimum value.
- (3π/2, 0): X-intercept.
- (2π, 1): Back to the start.

Image courtesy of Nagwa.
#The Cosine Function
- Periodicity: Repeats every 2π radians.
Quick Tip: Think of the cosine graph as the sine graph shifted to the left by π/2. They're the same shape, just starting at different points!
#
Final Exam Focus
#High-Priority Topics
- Unit Circle: Know your coordinates and angles like the back of your hand.
- Sine and Cosine Graphs: Understand their key points, periodicity, and how they relate to the unit circle.
- Transformations: Be ready to apply shifts, stretches, and reflections to these graphs.
#Common Question Types
- Multiple Choice: Identifying key values, graph features, and basic transformations.
- Free Response: Graphing sine and cosine functions, analyzing their properties, and solving related problems.
#Last-Minute Tips
- Time Management: Don't get bogged down on one question. Move on and come back if you have time.
- Common Pitfalls: Watch out for sign errors and incorrect angle values. Double-check your work!
- Strategies: Use your calculator wisely, but also practice mental calculations. Draw diagrams to help visualize problems.
Watch Out: Forgetting the negative signs for sine and cosine values in the 3rd and 4th quadrant is a common mistake. Always refer back to the unit circle!
#Practice Questions
Practice Question
#Multiple Choice Questions
-
What is the value of sin(3π/2)? (A) 1 (B) 0 (C) -1 (D) Undefined
-
Which of the following is the x-intercept of the cosine function? (A) (0,0) (B) (π,0) (C) (π/2,0) (D) (2π,0)
-
What is the maximum value of the function f(x) = 2sin(x) + 1? (A) 1 (B) 2 (C) 3 (D) 4
#Free Response Question
Consider the function f(x) = -2cos(x) + 1. (a) Sketch the graph of f(x) over the interval [0, 2π].
(b) Identify the amplitude, period, and vertical shift of the function.
(c) Find the x-intercepts of the function in the interval [0, 2π].
Scoring Rubric:
(a) Graph:
- Correct shape of the cosine curve (1 point)
- Correct amplitude and vertical shift (1 point)
- Accurate x-intercepts and key points (1 point)
(b) Characteristics:
- Amplitude is 2 (1 point)
- Period is 2π (1 point)
- Vertical shift is 1 (1 point)
(c) X-intercepts:
- Correctly finds the x-intercepts using algebra or the graph (2 points)
#Answers
Multiple Choice Answers
- (C)
- (C)
- (C)
Free Response Answers
(a) Graph:

(b) Characteristics:
- Amplitude: 2
- Period: 2π
- Vertical Shift: 1
(c) X-intercepts:
- Set -2cos(x) + 1 = 0
- Solve for cos(x) = 1/2
- x = π/3, 5π/3
You've got this! You're now equipped to tackle sine and cosine graphs with confidence. Remember to stay calm, use your resources, and trust your preparation. You're going to do great!
Continue your learning journey


How are we doing?
Give us your feedback and let us know how we can improve