Describing the Distribution of a Quantitative Variable
Noah Martinez
7 min read
Listen to this study note
Study Guide Overview
This AP Statistics study guide covers describing data distributions, focusing on shape, center, and spread. Shape includes symmetry, skewness, peaks (modes), outliers, and gaps. Center is discussed using mean, median, and mode. Spread is explained with range, standard deviation, and interquartile range (IQR). The guide also provides exam tips, common question types, and practice questions.
#AP Statistics: Describing Distributions - Your Night-Before-the-Exam Guide 🚀
Hey there, future AP Stats superstar! Let's get you prepped and confident for tomorrow. This guide is designed to be your quick, go-to resource for describing data distributions. We'll focus on the key elements: shape, center, and spread. Let's dive in!
# 1. Describing the Shape of a Distribution 🦋
When we look at a histogram or other data display, the first thing we want to understand is its shape. Here's what to look for:
- Symmetry:
- A distribution is symmetric if you can fold it in half, and both sides look like mirror images. Think of a butterfly! 🦋
Symmetrical data often has the mean and median close together.
-
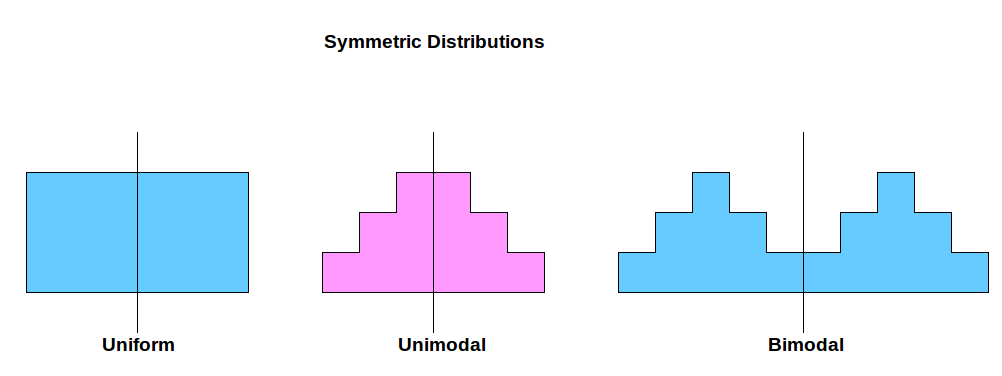
*Caption: A symmetric histogram, like a butterfly's wings, has balanced sides.*
- Skewness:
- Skewed distributions have a 'tail' that stretches out more on one side than the other.
- Right-skewed (positively skewed): The tail is longer on the right side. The mean is usually greater than the median. 🦝
- Left-skewed (negatively skewed): The tail is longer on the left side. The mean is usually less than the median.
Think of the skew as the direction the 'tail' is pointing. If the tail is on the right, it's right-skewed. If the tail is on the left, it's left-skewed.
-
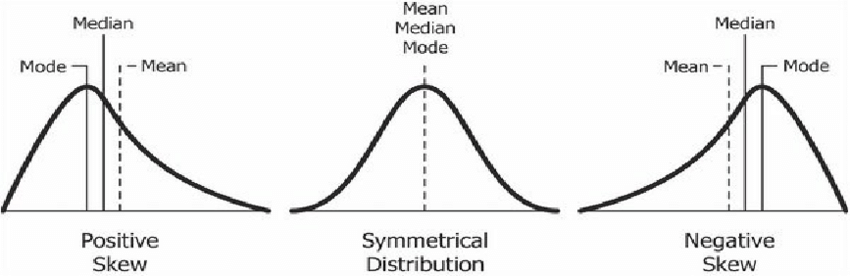
*Caption: Skewness pulls the 'tail' of the histogram to one side.*
-
Peaks (Modes):
- Mode: The most frequent value(s) in a dataset, represented by the peak(s) in a histogram. ⛰️
- Unimodal: One peak.
- Bimodal: Two peaks.
- Multimodal: More than two peaks.
- Uniform: No clear peaks; all values occur with roughly the same frequency.

Caption: Peaks indicate the modes, or most frequent values, in a dataset.
-
Outliers:
- Values that are significantly higher or lower than the rest of the data. 🗺️
Don't automatically discard outliers! Investigate them. They might be valid but unusual data points.
-
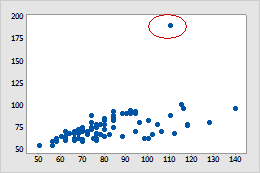
*Caption: Boxplots are great for spotting outliers.*
-
Gaps:
- Large spaces between data points. Gaps can suggest the presence of multiple groups within the data. 🌉

Caption: Gaps in a histogram can signal distinct subgroups in the data.
# 2. Measuring the Center of a Distribution 🎯
The center of a distribution gives us an idea of where the 'typical' value lies. Here are the key measures:
- Mean:
- The average value (sum of all values divided by the number of values).
- Best for symmetric distributions.
- Sensitive to outliers.
- Median:
- The middle value when the data is ordered from least to greatest.
- Best for skewed distributions or when outliers are present.
- Resistant to outliers.
- Mode:
- The most frequently occurring value.
- Useful for identifying the most common value(s), especially in multimodal distributions.
In a perfectly symmetric distribution, the mean, median, and mode are all the same!
# 3. Measuring the Spread of a Distribution 🕸️
The spread tells us how variable the data is. Here's how we measure it:
- Range:
- Maximum value minus the minimum value.
- Simple but sensitive to outliers.
- Standard Deviation:
- Measures the typical distance of data points from the mean.
- Best for symmetric distributions.
Think of standard deviation as the 'average spread' around the mean.
- Interquartile Range (IQR):
- The range of the middle 50% of the data (Q3 - Q1).
- Best for skewed distributions or when outliers are present.
- Resistant to outliers.
When describing a distribution, pair the mean with the standard deviation for symmetric data, and the median with the IQR for skewed data.
# Final Exam Focus 🎯
Alright, here's the game plan for tomorrow:
-
#High-Value Topics:
Describing distributions (shape, center, spread) is fundamental and appears in many questions. Make sure you can do this for different types of graphs.
-   Understanding the impact of outliers on different measures (mean vs. median, standard deviation vs. IQR).
-   Knowing when to use mean/standard deviation vs. median/IQR.
- Common Question Types:
- Multiple-choice questions asking you to identify the shape of a distribution from a histogram or other graph.
- Free-response questions requiring you to describe a distribution in context, including shape, center, and spread.
- Questions that ask you to compare two or more distributions.
- Time Management Tips:
- Quickly sketch the shape of the distribution on your scratch paper to help you visualize it.
- When describing distributions, use the acronym SOCS: Shape, Outliers, Center, Spread.
- Don't overthink it! Go with your gut feeling, but always justify your answers with evidence from the data.
- Common Pitfalls:
- Forgetting to mention context when describing a distribution in a free-response question. Always relate your answer back to what the data represents.
- Using the mean and standard deviation for skewed data.
- Misinterpreting the meaning of skewness (confusing left and right).
# Practice Questions 📝
Okay, let's test your knowledge with a few practice questions. Remember, you've got this!
Practice Question
#Multiple Choice Questions
-
A dataset has a mean of 50 and a median of 55. Which of the following is most likely true?
(a) The distribution is symmetric.
(b) The distribution is skewed to the left.
(c) The distribution is skewed to the right.
(d) The distribution is bimodal.
-
Which of the following is NOT resistant to outliers?
(a) Median
(b) IQR
(c) Range
(d) Standard deviation
-
A histogram shows a distribution with two distinct peaks. This distribution is best described as:
(a) Skewed
(b) Uniform
(c) Bimodal
(d) Symmetric
#Free Response Question
The following data represents the number of hours students spent studying for their AP Statistics exam:
10, 12, 15, 18, 20, 22, 25, 28, 30, 35, 60
(a) Create a boxplot of this data.
(b) Describe the shape, center, and spread of the distribution. Be sure to mention any outliers.
(c) Would the mean or median be a better measure of center for this data? Explain.
#Scoring Guide for FRQ
(a) Boxplot (3 points)
- 1 point for correct minimum, Q1, median, Q3, and maximum values.
- 1 point for correct box and whiskers.
- 1 point for correctly identifying the outlier.
(b) Description (4 points)
- 1 point for correctly identifying the shape as skewed right.
- 1 point for correctly stating the median (22 hours) or mean (25 hours).
- 1 point for correctly stating the IQR (13 hours) or standard deviation (13.9 hours).
- 1 point for mentioning the outlier (60 hours).
(c) Measure of Center (2 points)
- 1 point for selecting the median.
- 1 point for explaining that the median is more appropriate because the distribution is skewed and there is an outlier.
You've got this! Go get 'em tomorrow! 🎉
Continue your learning journey


How are we doing?
Give us your feedback and let us know how we can improve