Linear Regression Models
Jackson Hernandez
7 min read
Listen to this study note
Study Guide Overview
This study guide covers linear regression and extrapolation for AP Statistics. It explains the least squares regression line (LSRL), its equation (ŷ = a + bx), and how to calculate it. It also discusses the risks of extrapolation, using the LSRL to predict outside the data range, and emphasizes interpreting results in context. Practice problems and exam tips are included.
#AP Statistics: Linear Regression & Extrapolation - Your Night-Before Guide 🚀
Hey there, future AP Stats superstar! Let's get you feeling confident and ready to ace this exam. We're going to break down linear regression and extrapolation, making sure everything clicks into place. Let's do this!
# Linear Regression: Finding the Line of Best Fit
#What's the Big Idea?
Linear regression helps us understand the relationship between two variables: an explanatory variable (x) and a response variable (y). We're looking for a line that best represents the trend in our data. This line is called the least squares regression line (LSRL). 🤓
#The Least Squares Regression Line (LSRL)
The LSRL minimizes the sum of the squared differences between the actual y-values and the predicted y-values (ŷ). It's the line that fits the data best! The equation for the LSRL is:
-
ŷ: The predicted value of the response variable.
-
x: The value of the explanatory variable.
-
a: The y-intercept (where the line crosses the y-axis).
-
b: The slope (how much ŷ changes for every one-unit increase in x).
Key Point: Remember, ŷ is always a predicted value. The x-value is given from our dataset.
#How to Find the LSRL
- Gather Data: Collect your (x, y) data points.
- Calculate Slope (b): Use the formula (or your calculator) to find the slope.
- Calculate Y-intercept (a): Use the formula (or your calculator) to find the y-intercept.
- Write the Equation: Plug the values of a and b into the equation ŷ = a + bx.
# Extrapolation: Proceed with Caution!
#What is Extrapolation?
Extrapolation is using the LSRL to predict values outside the range of your original data. It's like trying to guess what happens in the next chapter of a book without reading it! 😬
#Why is it Risky?
Common Mistake: Extrapolation assumes the linear trend continues beyond your data, which is often not true. The farther you extrapolate, the more unreliable your prediction becomes.
-
Assumptions: We're assuming the relationship between x and y stays the same.
-
Unrealistic Results: Can lead to nonsensical predictions.
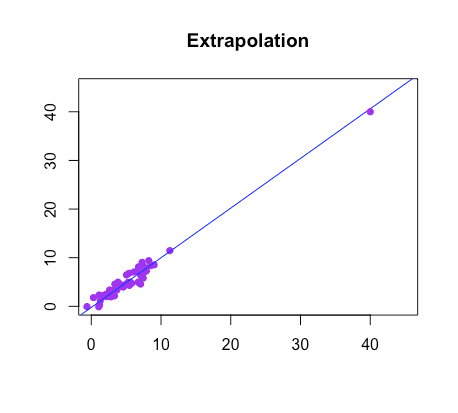
Image courtesy of statsforstem.org
#Example: Technology Comfort
Let's say we have an LSRL for technology comfort (ŷ) based on age (x) for 19-24 year olds:
If we try to predict the comfort level of a 45-year-old:
This doesn't make sense because comfort levels are on a scale of 1-10. This is a classic example of why extrapolation can go wrong! 🙅♂️
Memory Aid: Think of extrapolation as trying to predict the future based on the past. It can work, but it's not always accurate!
# Practice Problems
#Example 1: Study Hours and Exam Scores
LSRL:
Where ŷ is the predicted exam score and x is the number of study hours per week.
Question: Predict the exam score for a student who studies 15 hours per week.
Solution:
Interpretation: A student who studies 15 hours per week is predicted to score 34.8 on the exam.
Practice Question
#Multiple Choice Questions:
-
A researcher is studying the relationship between the number of hours a student studies and their exam score. They find a linear relationship and calculate the LSRL to be , where x is the number of hours studied and ŷ is the predicted exam score. If a student studies for 10 hours, what is their predicted exam score?
a) 50 b) 55 c) 100 d) 150
-
Which of the following is NOT a condition for using linear regression?
a) The relationship between the variables is linear. b) The data is normally distributed. c) The variance of the residuals is constant. d) The residuals are independent.
#Free Response Question:
A study was conducted to investigate the relationship between the amount of fertilizer used and the yield of corn. The following data was collected:
| Fertilizer (kg/hectare) | Yield (tons/hectare) |
|---|---|
| 10 | 4 |
| 20 | 6 |
| 30 | 7 |
| 40 | 9 |
| 50 | 10 |
(a) Create a scatterplot of the data with fertilizer on the x-axis and yield on the y-axis.
(b) Calculate the equation of the least squares regression line.
(c) Interpret the slope of the regression line in the context of the problem.
(d) Predict the yield of corn if 60 kg/hectare of fertilizer is used.
(e) Is it appropriate to use the LSRL to predict the yield of corn for 100 kg/hectare of fertilizer? Explain your reasoning.
Scoring Breakdown:
(a) (1 point) - Correctly labeled axes and plotted points.
(b) (2 points) - Correctly calculated slope and y-intercept, and stated the equation of the LSRL.
(c) (1 point) - Correctly interpreted the slope in context (e.g., for every 1 kg/hectare increase in fertilizer, the yield is predicted to increase by [slope] tons/hectare).
(d) (1 point) - Correctly predicted the yield using the LSRL with x=60. (e) (2 points) - Explained that extrapolation is risky and that 100 kg/hectare is outside the range of the data, making the prediction unreliable.
# Final Exam Focus
#High-Value Topics
-
Understanding LSRL: What it represents, how to calculate it, and how to interpret the slope and y-intercept.
-
Extrapolation: Knowing when it's appropriate and when it's not.
-
Interpretation in Context: Being able to explain your results using the context of the problem.
High-Value Topic: Linear regression is a foundational concept. Expect to see it in multiple choice and free response questions.
#Exam Tips
Exam Tip: Always interpret your results in the context of the problem. Don't just give numbers; explain what they mean!
- Time Management: Don't spend too long on one question. Move on and come back if you have time.
- Show Your Work: Even if you use your calculator, show the steps you took to get your answer.
- Read Carefully: Pay attention to the details of the question. What is it asking you to do?
#Common Pitfalls
-
Forgetting Context: Answers without context lose points.
-
Misinterpreting Slope: Remember, slope is the change in ŷ for every one-unit increase in x.
-
Extrapolating Blindly: Don't extrapolate without thinking about whether it makes sense.
Quick Fact: A strong correlation does not imply causation. Be careful not to make causal claims based on regression results alone.
You've got this! Go into the exam with confidence, and remember everything we've covered here. You're ready to rock it! 💪
Continue your learning journey


How are we doing?
Give us your feedback and let us know how we can improve