Mastering Data Analysis in IB Biology: A Student's Guide to Conquering Graphs and Experiments
By Arpit Jain

Data analysis often feels like the mysterious final boss in IB Biology. You've battled through complex concepts, memorized intricate processes, and conducted meticulous experiments. Now, it's time to unlock the secrets hidden within your data. Don't worry, this isn't as intimidating as it sounds! With the right approach, data analysis can become your superpower, both in the exam hall and beyond.

Deciphering the Language of Graphs
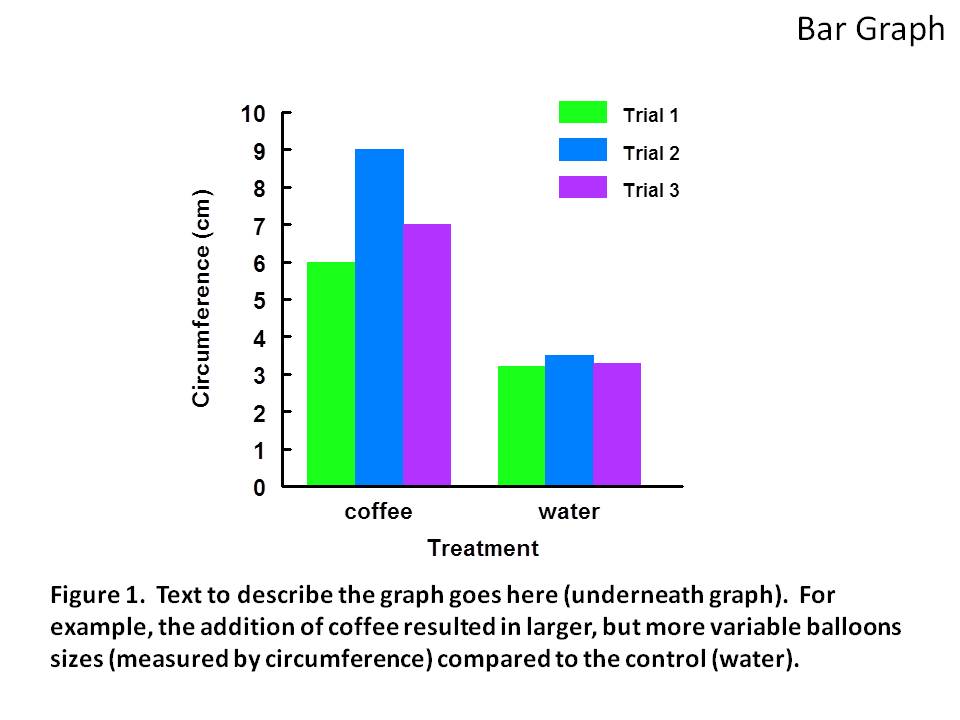
Graphs are the storytellers of the scientific world. They translate raw data into visual narratives, revealing trends, patterns, and relationships. IB Biology often features various graph types, each with its own strengths. Familiarize yourself with bar graphs, line graphs, scatter plots, and histograms. Understanding their purpose and interpretation is key to unlocking your data's secrets.
For instance, a line graph might illustrate the growth rate of bacteria over time, while a bar graph could compare enzyme activity under different conditions. Recognizing these nuances allows you to extract meaningful insights from the presented data.

From Data to Deductions: Analyzing Experiments
Experimental data analysis involves more than just plotting points on a graph. It's about understanding the story behind those points. Start by identifying the independent and dependent variables in your experiment. What did you change? What did you measure? This clarity forms the foundation of your analysis.
Next, look for trends and relationships. Does increasing the substrate concentration lead to a proportional increase in enzyme activity? Does temperature affect the rate of photosynthesis? Use statistical analysis tools, when appropriate, to strengthen your interpretations. Calculate the mean, standard deviation, and apply statistical tests to determine the significance of your findings.

Beyond the Grade: Data Analysis in the Real World
Mastering data analysis equips you with a valuable skillset that extends far beyond your IB Biology exams. In a world increasingly driven by data, the ability to analyze, interpret, and draw conclusions from complex datasets is highly sought after. Whether you're pursuing a career in research, medicine, environmental science, or even finance, data analysis skills will prove invaluable.
Remember, data analysis is not just about finding the 'right' answer. It's about asking the right questions, critically evaluating evidence, and communicating your findings effectively. So, embrace the challenge, hone your skills, and unlock the power of data analysis in your IB Biology journey and beyond.