Inference for Categorical Data: Proportions
Ava Garcia
8 min read
Listen to this study note
Study Guide Overview
This study guide covers statistical inference for proportions, including confidence intervals and significance tests. It explains how to estimate population proportions from sample data, test claims about population proportions, and perform inference with two proportions. Key concepts include sample proportion, sample size, confidence level, null hypothesis, alternative hypothesis, and p-value. The guide also emphasizes conditions for inference (randomness, independence, and normality) and provides practice questions.
#AP Statistics: Inference for Proportions - Your Ultimate Study Guide 🚀
Hey there, future AP Stats superstar! Let's break down inference for proportions. This is a HUGE topic, so let's get it organized and make sure you're ready to rock the exam. Remember, you've got this! 💪
[TOC]
#What is Statistical Inference?
Ever seen a crazy statistic and thought, "Wait, is that even true?" That's where statistical inference comes in! It's how we use data from a sample to make educated guesses about a larger population. Think of it like this: we're detectives, using clues (sample data) to solve a mystery (population truth). 🕵️
Key Idea: We use sample data to estimate population parameters or test claims about them.
#Two Main Tools:
- Confidence Intervals: Estimating a range where the true population parameter likely lies. 🎯
- Significance Tests: Testing a claim about a population parameter. 🤔
#Confidence Intervals: Estimating the Unknown
Confidence intervals are all about estimating a population proportion using a sample proportion. It's like saying, "We're pretty sure the real answer is somewhere in this range!" 📏
#Three Key Ingredients:
-
Sample Proportion (p̂): Your best guess from your sample. Remember, a random sample is crucial here! 🎲
Common Mistake: Forgetting that a non-random sample can lead to biased results. There's no way to fix a lack of randomness! 🙅
-
Sample Size (n): The number of individuals in your sample. Larger samples = more precise estimates. 📈
Quick Fact: Larger sample sizes lead to narrower confidence intervals. Think of it as narrowing your focus for a clearer picture. 🔍
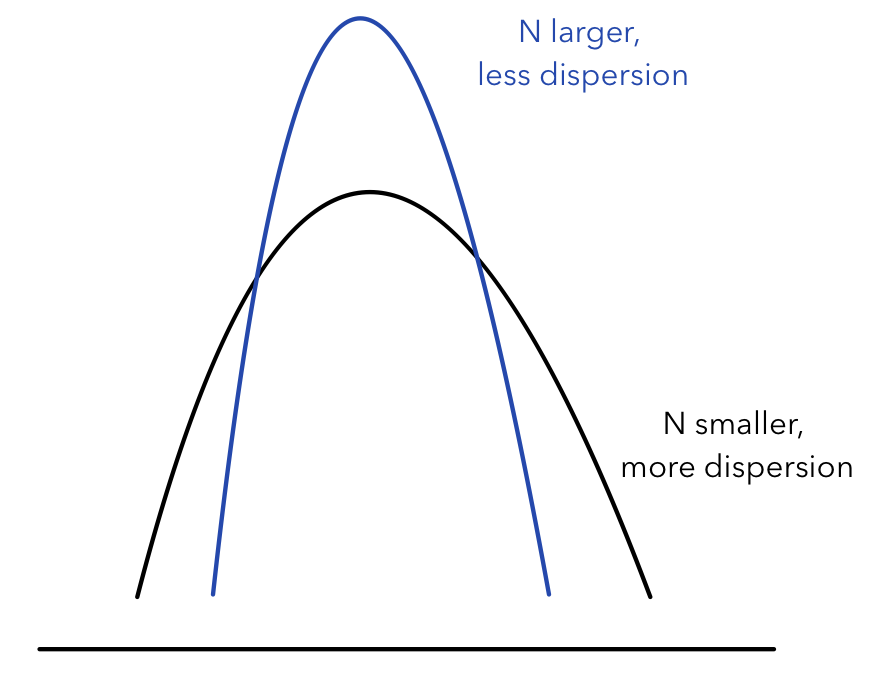
Caption: As sample size increases, the standard deviation of the sampling distribution decreases, leading to a narrower confidence interval.
-
Confidence Level (C): How confident you are that the interval contains the true population parameter. Common levels are 90%, 95%, and 99%. 💯
Memory Aid: Think of confidence level like a fishing net. A wider net (higher confidence level) is more likely to catch the fish (true parameter), but it's also less precise. 🎣
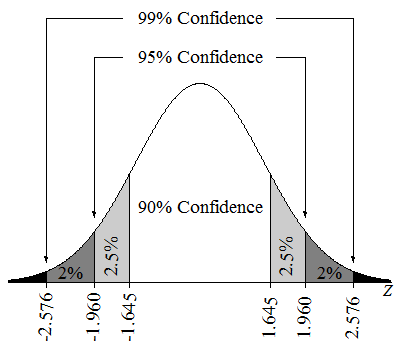
Caption: Visual representation of how confidence intervals capture the true population parameter with varying confidence levels.
Quick Fact: A 95% confidence level means that if we took 100 samples, about 95 of the resulting confidence intervals would contain the true population proportion.
Note: The confidence level also determines the critical value (z) from the standard normal distribution. Higher confidence = larger z* = wider interval.* 🤓
#Significance Tests: Testing Claims
Significance tests are used to check if a claim about a population proportion is plausible. It's like a courtroom trial for your data! ⚖️
#Key Concepts:
-
Null Hypothesis (H₀): The claim we're trying to disprove. We assume it's true until proven otherwise. 🤨
-
Alternative Hypothesis (Hₐ): What we suspect might be true if the null hypothesis is false. 🤔
-
P-value: The probability of observing our sample data (or more extreme) if the null hypothesis were true. 📉
Exam Tip: A small p-value (typically less than 0.05) provides evidence against the null hypothesis. Remember, we never accept the null hypothesis, we either reject it or fail to reject it.
Memory Aid: "If the p is low, the null must go!" (Reject H₀). If the p is high, the null will fly! (Fail to reject H₀).
#Conditions for Inference (Same as Confidence Intervals):
- Randomness: Sample must be randomly selected. 🎲
- Independence: Individuals in the sample must be independent of each other. 👯
- Normality: Sample size must be large enough to assume a normal sampling distribution. (Use the same conditions as sampling distributions from Unit 5) 🔔
#Inference with Two Proportions
Sometimes, we need to compare two proportions, like in a treatment vs. control group. This is common in experimental design. 🧪
#Key Points:
-
Two Samples: We have two independent samples, each with its own sample proportion. 👯
-
Conditions: The conditions for inference (randomness, independence, normality) must be met for both samples. ✅
-
Sampling Distribution: The sampling distribution of the difference between two proportions is approximately normal.
-
Standard Deviation: Use the formula provided on the AP Statistics formula sheet. 📝
High Value Topic: Inference with two proportions is a common topic on the AP exam. Make sure you know how to apply the conditions and formulas. 💯
#Example:
Let's say we are testing a new drug. We randomly assign participants to a treatment group (new drug) or a control group (placebo). We then compare the proportion of people who recovered faster in each group. If the difference is statistically significant, it suggests the drug is effective. 💊
#Final Exam Focus
Okay, let's get down to brass tacks. Here's what to focus on for the exam:
- Conditions for Inference: Randomness, independence, normality. These are crucial! ✅
- Confidence Intervals: Know how to construct and interpret them. 🎯
- Significance Tests: Understand the logic, hypotheses, p-values, and conclusions. 🤔
- Two-Proportion Inference: Be comfortable comparing two groups. 👯
- Context: Always interpret your results in the context of the problem. 📝
#Last-Minute Tips:
- Time Management: Don't get bogged down on one question. Move on and come back if needed. ⏰
- Common Pitfalls: Watch out for common mistakes like not checking conditions or misinterpreting p-values. ⚠️
- FRQ Strategies: Show all your work, explain your reasoning, and interpret your results. ✍️
#Practice Questions
Practice Question
#Multiple Choice Questions
-
A polling organization conducts a survey to estimate the proportion of adults who support a certain policy. They take a random sample of 1000 adults and find that 550 support the policy. Which of the following is a 95% confidence interval for the true proportion of adults who support the policy? (A) 0.55 ± 1.96 * sqrt((0.550.45)/1000) (B) 0.55 ± 1.645 * sqrt((0.550.45)/1000) (C) 0.55 ± 1.96 * sqrt((0.550.45)/1000000) (D) 0.55 ± 2.576 * sqrt((0.550.45)/1000) (E) 0.55 ± 2.576 * sqrt((0.55*0.45)/1000000)
-
A researcher wants to test the claim that more than 60% of students at a university support a new initiative. They take a random sample of 200 students and find that 130 support the initiative. What is the null and alternative hypothesis? (A) H₀: p = 0.60, Hₐ: p < 0.60 (B) H₀: p = 0.60, Hₐ: p > 0.60 (C) H₀: p > 0.60, Hₐ: p = 0.60 (D) H₀: p ≠ 0.60, Hₐ: p = 0.60 (E) H₀: p = 0.65, Hₐ: p < 0.65
-
In a study comparing the effectiveness of two different teaching methods, researchers randomly assign students to either Method A or Method B. After the study, they find that 70 out of 100 students in Method A passed a test, while 60 out of 100 students in Method B passed. What is the standard error for the difference in proportions (p̂A - p̂B)? (A) sqrt((0.70.3)/100 + (0.60.4)/100) (B) sqrt((0.70.3)/100 - (0.60.4)/100) (C) sqrt((0.70.3)/200) (D) sqrt((0.60.4)/200) (E) sqrt((0.70.3 + 0.60.4)/200)
#Free Response Question
A researcher is interested in studying the proportion of adults who prefer coffee over tea in a certain city. They take a random sample of 400 adults and find that 220 prefer coffee.
(a) Construct and interpret a 95% confidence interval for the true proportion of adults in the city who prefer coffee over tea. (4 points)
(b) Suppose the researcher wants to conduct a significance test to see if the true proportion of adults who prefer coffee is significantly different than 50%. State the null and alternative hypotheses. (1 point)
(c) Calculate the test statistic and p-value for the significance test. (3 points)
(d) What conclusion can you make about your test? (1 point)
Scoring Guide
(a) Confidence Interval (4 points)
-
1 point: Correct sample proportion: p̂ = 220/400 = 0.55
-
1 point: Correct standard error: SE = sqrt((0.55 * 0.45) / 400) ≈ 0.0248
-
1 point: Correct critical value: z* = 1.96 (for 95% confidence)
-
1 point: Correct interval and interpretation: 0.55 ± 1.96 * 0.0248 = (0.501, 0.599). We are 95% confident that the true proportion of adults in the city who prefer coffee over tea is between 0.501 and 0.599. (b) Hypotheses (1 point)
-
1 point: H₀: p = 0.50, Hₐ: p ≠ 0.50
(c) Test Statistic and P-value (3 points)
- 1 point: Correct test statistic formula: z = (p̂ - p₀) / SE
- 1 point: Correct test statistic calculation: z = (0.55 - 0.50) / sqrt((0.50 * 0.50) / 400) = 2
- 1 point: Correct p-value: p-value ≈ 0.0456
(d) Conclusion (1 point)
- 1 point: Since the p-value (0.0456) is less than 0.05, we reject the null hypothesis. There is sufficient evidence to suggest that the true proportion of adults in the city who prefer coffee over tea is significantly different than 50%.
You've got this! Go ace that exam! 🎉
Continue your learning journey


How are we doing?
Give us your feedback and let us know how we can improve