Introducing Statistics: Why Be Normal?
Isabella Lopez
7 min read
Listen to this study note
Study Guide Overview
This AP Statistics study guide covers data distributions, focusing on random and non-random variation. It explains normality, its importance in probability calculations and standardization using z-scores. The guide emphasizes the Large Counts Condition for normal distribution approximation and provides an example. Finally, it offers practice questions covering these concepts and exam tips for success.
#AP Statistics Study Guide: Mastering Distributions and Normality
Hey there, future AP Stats ace! Let's get you prepped and confident for your exam. This guide is designed to be your go-to resource, especially the night before the big day. We'll break down complex ideas into easy-to-digest pieces, so you can feel totally ready to crush it! 🚀
#Understanding Variation in Data Distributions
Understanding variation is key to statistical analysis. It helps us distinguish between random fluctuations and meaningful patterns in our data.
#Random Variation
- Occurs when data values are scattered without a discernible pattern.
- Often seen in data from random samples.
- No underlying structure; just pure chance at play.
#Non-Random Variation
- Indicates an underlying pattern or structure in the data.
- Can result from:
- Measurement error
- Bias
- Systematic differences in the population
- Leads to skewed or distorted distributions.
Always consider potential sources of variation when analyzing data. This helps you avoid drawing incorrect conclusions and ensures your inferences are sound.
#Normality: What Does it Really Mean?
In statistics, "normal" doesn't mean "typical" or "average." It refers to a specific bell-shaped curve that's fundamental to many statistical calculations. Think of it as the VIP of distributions! 🌟
#The Normal Curve
- A symmetrical, bell-shaped curve.
- Used extensively in statistical inference.
- Essential for calculating probabilities in sampling distributions.
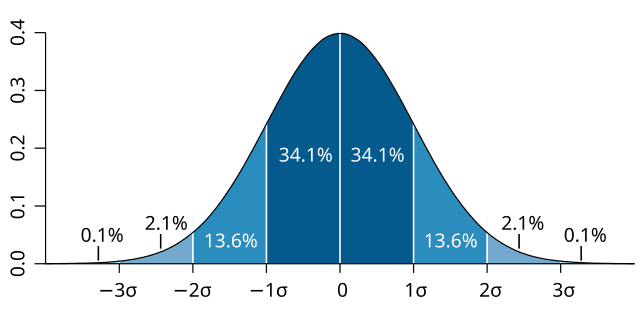
Caption: The normal distribution is a symmetrical, bell-shaped curve. The mean, median, and mode are all equal and located at the center of the distribution.
#Why is Normality So Important?
- Probability Calculations: We use the normal curve to find probabilities in sampling distributions (remember Unit 5?).
- Standardization: By standardizing our sample data (using z-scores), we can use the normal curve to make inferences.
- Z-Score Chart: We can use our z-score chart to determine probabilities.
The normal curve is the foundation for many statistical tests and confidence intervals. Understanding its properties is crucial for success on the AP exam.
#How to Check for Normality: The Large Counts Condition
Remember "Large Counts = Normal Counts!" If your expected successes and failures are large enough, your sampling distribution is approximately normal.
To ensure our sampling distribution is approximately normal, we must verify the Large Counts Condition.
- Large Counts Condition: Both expected successes and expected failures must be at least 10. * Formula:
- Where:
- = sample size
- = probability of success
Students often forget to check both conditions ( and ). Make sure you verify both!
#Example: Hockey Players and Broken Bones
Let's say we believe 95% of hockey players break a bone in their life. We sample 500 retired players to test this.
- Check:
- (Successes)
- (Failures)
- Conclusion: Since both conditions are met, we can use the normal curve for our test.
Caption: Checking the large counts condition is crucial before using the normal distribution to analyze proportions.
#Final Exam Focus
Focus on these key areas for the exam: Understanding sampling distributions, checking conditions for inference, and applying normal curve calculations are critical for success!
- Key Topics:
- Random vs. Non-random variation
- The meaning of a normal distribution
- Importance of the normal curve in inference
- Large Counts Condition
- Common Question Types:
- MCQs testing your understanding of distributions.
- FRQs requiring you to check conditions and perform inference.
- Time Management:
- Quickly identify question types.
- Prioritize questions you know well.
- Don't get stuck on one problem.
- Common Pitfalls:
- Forgetting to check conditions (like Large Counts).
- Misinterpreting the meaning of "normal."
- Incorrectly calculating probabilities.
Practice, practice, practice! The more you work through problems, the more confident you'll become. Review your notes and focus on areas where you feel less comfortable.
#Practice Questions
Practice Question
Multiple Choice Questions
-
A researcher is studying the distribution of heights in a population. Which of the following would indicate non-random variation? (a) The heights are normally distributed. (b) The heights are uniformly distributed. (c) The heights are clustered around two distinct values. (d) The heights are randomly scattered with no discernible pattern.
-
A polling company wants to estimate the proportion of voters who support a particular candidate. They plan to take a sample of 1000 voters. The large counts condition requires: (a) The sample size is large enough. (b) The population is normally distributed. (c) Both and . (d) The sample is randomly selected.
-
If a sampling distribution is approximately normal, what can we use to calculate probabilities? (a) The t-distribution. (b) The chi-square distribution. (c) The normal curve. (d) The binomial distribution.
Free Response Question
A local high school claims that 60% of its students participate in at least one extracurricular activity. A student decides to test this claim by taking a random sample of 200 students and finds that 108 of them participate in at least one extracurricular activity.
(a) State the null and alternative hypotheses for this test.
(b) Verify that the conditions for inference are met.
(c) Calculate the test statistic.
(d) Calculate the p-value.
(e) State your conclusion in the context of the problem. Use a significance level of 0.05. Scoring Breakdown
(a) (1 point) * Null hypothesis: * Alternative hypothesis:
(b) (3 points) * Random: The problem states a random sample was taken. * Large Counts: and . Both conditions are met. * Independence: Assume the sample of 200 students is less than 10% of all students at the high school.
(c) (2 points) * Sample proportion: * Test statistic:
(d) (1 point) * p-value:
(e) (1 point) * Since the p-value (0.0832) is greater than the significance level (0.05), we fail to reject the null hypothesis. There is not sufficient evidence to suggest that the proportion of students who participate in at least one extracurricular activity is different from 60%.
You've got this! Remember, stay calm, trust your preparation, and tackle each question with confidence. You're ready to shine! ✨
Continue your learning journey


How are we doing?
Give us your feedback and let us know how we can improve